
The first article in this series established a statistical baseline for the world’s largest field crops and tree or perennial crops. Using FAOSTAT’s Production: Crops and Livestock Products data, it compared harvested area and production globally and then followed country-level harvested-area change between 2015 and 2024. The FAOSTAT data domain and its normalized bulk download make those figures independently reproducible.
This second article moves from national statistics to spatial patterns. It narrows the focus to soybean, oil palm and olive, then demonstrates how global gridded data can be transformed into an accessible geospatial tool for business-oriented exploration.
Why soybean?
The first article’s field-crop table places soybean fourth globally by harvested area and also fourth by production, at 143.2 million hectares and 397.7 million tonnes in 2024. Those values and the crops ranked above and below soybean can be checked directly in the first article’s global field-crop table.
Soybean also has an immediate regulatory connection. Regulation (EU) 2023/1115—the EU Deforestation Regulation, or EUDR—names soya as one of seven relevant commodities. Article 1 and Article 2 of the consolidated EUDR text on EUR-Lex identify the seven as cattle, cocoa, coffee, oil palm, rubber, soya and wood.
Because the EUDR is an EU regulation, it applies directly in every EU Member State.
What exactly does the EUDR cover?
The legal scope is much more detailed than a list of seven plant or animal species. The EUDR names seven broad commodities, but Annex I contains many product subcategories identified by customs classification codes. The table below provides only a few plain-language examples. It is not a complete list and should not be used as a substitute for Annex I:
| Relevant commodity | Plain-language anchor | Examples of products listed in Annex I |
|---|---|---|
| Soya | Soybeans (Glycine max) | Soya beans, flour and meal, soya-bean oil and oilcake |
| Oil palm | Oil-palm production | Palm nuts and kernels, palm and palm-kernel oils, oilcake and specified derivatives |
| Coffee | Coffee production | Coffee, roasted or unroasted, coffee husks and skins, and specified coffee-containing substitutes |
| Cocoa | Cacao production | Beans, shells and husks, paste, butter, powder and chocolate preparations |
| Rubber | Natural-rubber production | Natural rubber, compounded rubber and specified downstream rubber articles |
| Wood | Wood-producing trees and shrubs | The wood, pulp, paper, printed-material and furniture categories enumerated in Annex I |
| Cattle | Bovine livestock | Live cattle, meat, offal and the cattle-derived categories enumerated in Annex I |
The authoritative product list is the current Annex I in the consolidated EUDR. Product scope can change: on 13 July 2026 the European Commission announced a delegated act updating Annex I, including proposed removals and additions, subject to the applicable scrutiny and entry-into-force process. Any operational compliance decision should therefore check the latest consolidated legal text rather than rely on a static blog table.
Why oil palm?
In the first article’s tree/perennial comparison, oil palm ranks first by both harvested area and production: 29.0 million hectares and 418.7 million tonnes in 2024. The comparison is available in the tree and perennial crop table.
The 418.7 million-tonne production figure refers to oil-palm fruit, not extracted palm oil. The fruit produces two distinct products: palm oil from its fleshy pulp and palm-kernel oil from its seed. Oil palm also produces more oil per unit of land than other oil crops, helping explain its commercial importance (FAO, Oil Palm).
High productivity makes oil palm commercially important, but the location and manner of its expansion also connect it to deforestation. A single global ranking for oil palm would be misleading because studies use different commodity groups, periods and geographic boundaries. The broader global comparison below places oil palm and soy within the oilseeds and oleaginous-fruits category rather than attributing the entire category to either crop.
Global commodity-driven deforestation, 2001–2022
| Rank | Land-use or commodity group | Share of global commodity-driven deforestation |
|---|---|---|
| 1 | Pasture, primarily associated with cattle | 42% |
| 2 | Oilseeds and oleaginous fruits, especially oil palm and soy | 16% |
| 3 | Forest plantations | 14% |
| 4 | Maize, rice and cassava combined | approximately 11% |
| 5 | Stimulant and aromatic crops, mainly cocoa and coffee | 3% |
| 6 | Fibre crops, mainly rubber | 2% |
Although oilseeds and oleaginous fruits rank below pasture in this global comparison, the type of land converted can substantially affect the environmental impact. The same study estimates that oil palm alone accounts for nearly 55% of emissions from commodity-driven deforestation on peatlands. Source: Nature Food, global DeDuCE analysis.
Forest conversion associated with new oil-palm plantations
The relationship has also changed over time and differs within producing countries. In Malaysia, the estimated share of newly established oil-palm plantations originating from forest conversion declined between the two periods shown below. These percentages describe the origin of new plantation land; they do not represent oil palm’s share of all deforestation.
| Geography | 1990–2000 | 2006–2010 | Change |
|---|---|---|---|
| Malaysia, nationwide | approximately 56% | approximately 33% | ↓ 23 percentage points |
| Peninsular Malaysia | approximately 38% | approximately 6% | ↓ 32 percentage points |
Source: Vijay et al., PLOS ONE, review of oil-palm expansion in Peninsular Malaysia.
Together, the global and historical comparisons show both a material relationship with deforestation and why oil palm should not be assigned one universal rank. A broader review reports that its direct contribution to regional tropical deforestation has ranged from about 3% in West Africa to 50% in Malaysian Borneo. The same review notes that oil palm supplies about 40% of global vegetable-oil demand from less than 5.5% of the land used for oil crops. Expansion into forests and carbon-rich peatlands is therefore the central concern; replacing oil palm with lower-yielding oil crops could require more land if demand remained unchanged (Meijaard et al., Nature Plants).
This combination of high productivity, widespread use and land-use risk connects the regulatory and commercial sides of the use case. Palm oil is one of the EUDR’s seven relevant commodities, while its downstream uses reach several sectors. An FAO industry review describes food uses and non-food demand from the soap, detergent and cosmetics industries, as well as energy uses including biofuel and biodiesel (FAO, Oil palm industry growth in Africa). That breadth means spatial concentration is relevant to food manufacturers, consumer-goods companies, energy markets and supply-chain due diligence.
Why olive?
The first article ranks olive fifth among tree/perennial crops, at 11.1 million hectares harvested and 25.6 million tonnes produced in 2024 (global crop/tree table). The country distribution is strongly Mediterranean, but the claim that every leading country for both harvested area and production is Mediterranean is too absolute. Because harvested area and production produce different country rankings, they are presented separately rather than paired by row.
Harvested-area ranking (2024)
This ranking uses 2024 data to maintain the connection with the first article.
| Rank | 1 | 2 | 3 | 4 | 5 | 6 | 7 | 8 | 9 | 10 | 11 | 12 | 13 | 14 | 15 |
|---|---|---|---|---|---|---|---|---|---|---|---|---|---|---|---|
| Country | Spain | Tunisia | Morocco | Italy | Türkiye | Greece | Syria | Algeria | Portugal | Libya | Argentina | Egypt | Lebanon | Jordan | Albania |
| Area harvested 2024 (Mha) |
2.646 | 1.866 | 1.239 | 1.083 | 0.913 | 0.848 | 0.681 | 0.474 | 0.381 | 0.185 | 0.127 | 0.118 | 0.065 | 0.058 | 0.051 |
Production comparison (ranked by 2023 production)
How to read the table: Rank is determined by 2023 production. The 2024 column provides the following year’s value for the same country, and an asterisk indicates that FAOSTAT does not provide a 2024 production value.
| Rank | Country | Production 2023 (Mt) | Production 2024 (Mt) | Change in production, 2023–2024 | Production/area 2023 (t/ha) |
|---|---|---|---|---|---|
| 1 | Spain | 5.101 | 8.310 | ↑ +62.9% | 1.92 |
| 2 | Greece | 2.499 | * | —* | 2.97 |
| 3 | Italy | 2.398 | 2.300 | ↓ −4.1% | 2.22 |
| 4 | Türkiye | 1.520 | 3.750 | ↑ +146.7% | 1.68 |
| 5 | Portugal | 1.195 | 1.341 | ↑ +12.2% | 3.14 |
| 6 | Egypt | 1.185 | 1.270 | ↑ +7.1% | 10.16 |
| 7 | Tunisia | 1.093 | 1.056 | ↓ −3.4% | 0.57 |
| 8 | Morocco | 0.988 | 1.080 | ↑ +9.3% | 0.85 |
| 9 | Algeria | 0.913 | 0.913 | ↓ −0.01% | 1.88 |
| 10 | Syria | 0.697 | 0.785 | ↑ +12.6% | 1.03 |
| 11 | Argentina | 0.342 | 0.347 | ↑ +1.5% | 2.75 |
| 12 | Saudi Arabia | 0.339 | 0.351 | ↑ +3.6% | 15.20 |
| 13 | Peru | 0.178 | 0.024 | ↓ −86.6% | 6.23 |
| 14 | Jordan | 0.169 | 0.221 | ↑ +30.3% | 2.93 |
| 15 | Libya | 0.143 | 0.129 | ↓ −9.9% | 0.69 |
* FAOSTAT reports Greece’s harvested area for 2024 but does not provide a corresponding 2024 olive-production value. The cell is intentionally left without a value, and no change is calculated. Production countries remain ranked by 2023 values so that every country in the ranking is compared on the same basis.
The final column divides each country’s 2023 production by its 2023 harvested area, keeping the numerator and denominator in the same year. As a descriptive screen, values above 3 t/ha form a higher-output group in this table—Saudi Arabia, Egypt, Peru and Portugal—while values below 1 t/ha form a lower-output group—Tunisia, Morocco and Libya. The remaining countries lie between those two thresholds.
Higher output per harvested hectare can be consistent with irrigated, closely planted and more mechanized grove systems, while lower output can be consistent with extensive, low-density and rain-fed cultivation (EIP-AGRI olive-production systems). However, this national ratio is an indicator—not a direct measurement of how much intensive or traditional grove area a country has. Weather, alternate bearing, cultivar, tree age, management and statistical methods can also affect the result.
The source records can be verified in the FAOSTAT normalized bulk dataset. The defensible conclusion is that global olive area and production are overwhelmingly concentrated in and around the Mediterranean climatic and historical sphere, not that every leading country lies on the Mediterranean coast.
Saudi Arabia’s presence among the leading production records shows why the Mediterranean pattern should not be treated as an absolute rule: large-scale olive production also exists beyond the countries bordering the Mediterranean. The clearest example is Al-Jouf, Saudi Arabia’s leading olive-producing region. The Saudi Press Agency reports that Al-Jouf accounts for 290,000 tonnes of the country’s production from about 18 million trees (Saudi Press Agency, 2025). Its commercial scale is also visible in Al-Jouf Agricultural Development Company’s 7,713-hectare operation, which Guinness World Records verified in 2024 as the world’s largest modern olive farm (Guinness World Records).
The olive has been associated with Mediterranean societies for millennia. The International Olive Council describes archaeological evidence across the basin and the spread of cultivation through Phoenician, Greek and Roman networks (IOC, History of the Olive Tree). Its World Catalogue places cultivated olive primarily between 30° and 45° latitude in Mediterranean climates characterized by hot, dry summers and dates cultivation in the eastern Mediterranean to roughly 6,000 years ago (IOC World Catalogue, origin and distribution).
From global statistics to actionable spatial insight
FAOSTAT provides national totals, while CROPGRIDS adds a global spatial view of where crops are concentrated. CROPGRIDS covers 173 crops for the year 2020 at 0.05° resolution, approximately 5.6 km at the equator, and provides both annual harvested area and physical crop area (Tang et al., 2024; CROPGRIDS data archive).
Global grids can help users screen crop concentration, compare growing regions across national borders and identify areas where more detailed investigation may be valuable. As an example of what can be derived from the grids, the table below shows three large connected concentrations for each selected crop based on harvested area:
| Crop | Rank | Country | CROPGRIDS cells | Harvested area represented |
|---|---|---|---|---|
| Soybean | 1 | Argentina | 7,699 | 8.91 Mha |
| Soybean | 2 | Brazil | 4,814 | 7.41 Mha |
| Soybean | 3 | United States | 3,826 | 3.63 Mha |
| Palm oil | 1 | Indonesia | 741 | 2.00 Mha |
| Palm oil | 2 | Indonesia | 460 | 1.22 Mha |
| Palm oil | 3 | Nigeria | 160 | 0.43 Mha |
| Olive | 1 | Tunisia | 1,946 | 2.34 Mha |
| Olive | 2 | Syria | 1,064 | 0.40 Mha |
| Olive | 3 | Spain | 849 | 0.22 Mha |
These values are an illustrative output derived from CROPGRIDS, rather than independent field-survey measurements. The country labels provide a concise geographic reference, while a connected concentration may extend across national borders.
The value of these data increases when they are transformed from downloadable files into information that people can explore and use. Monopteryx converts the source grids into an interactive geographic view.
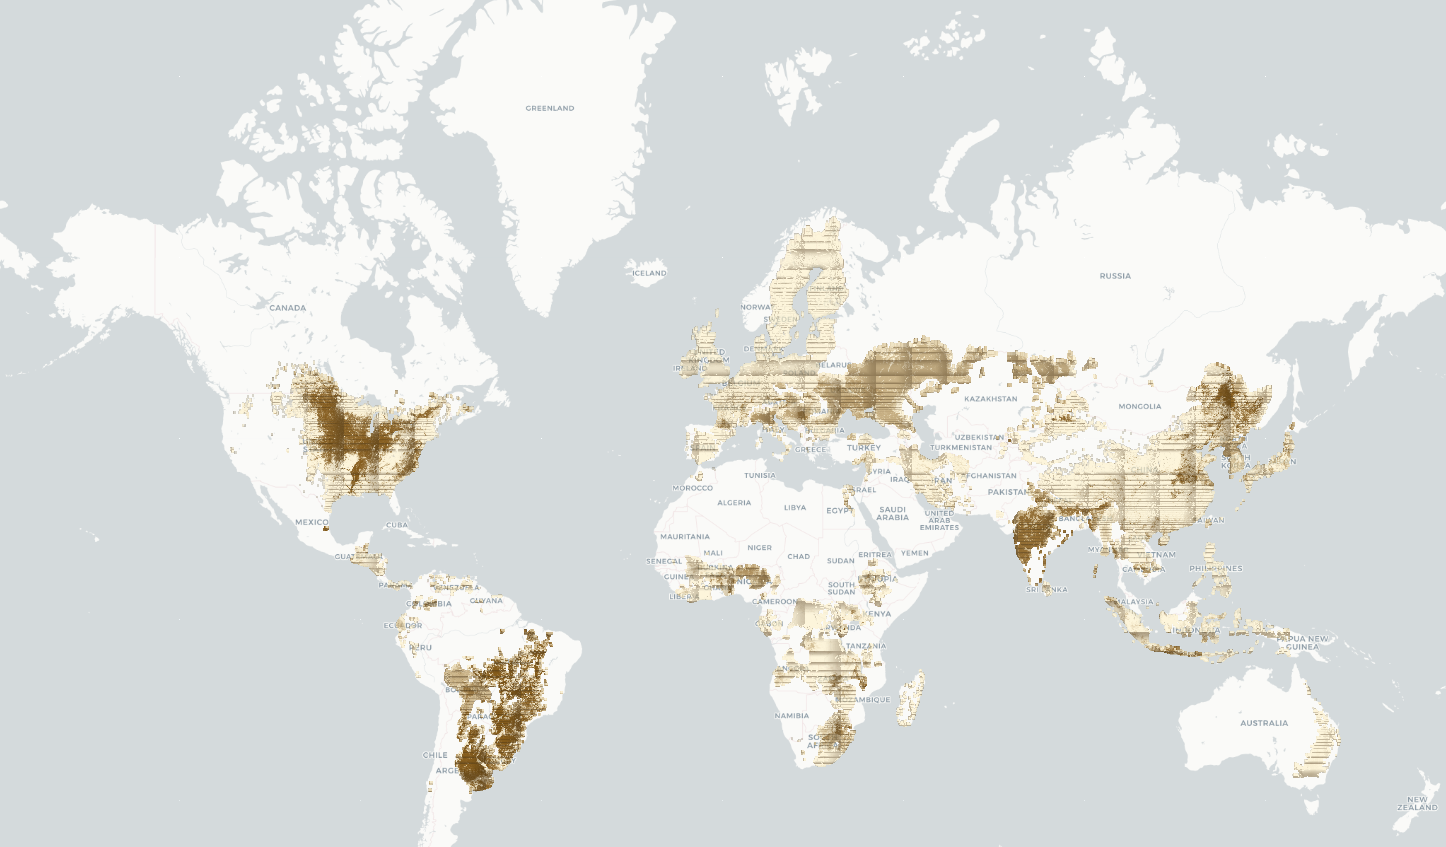
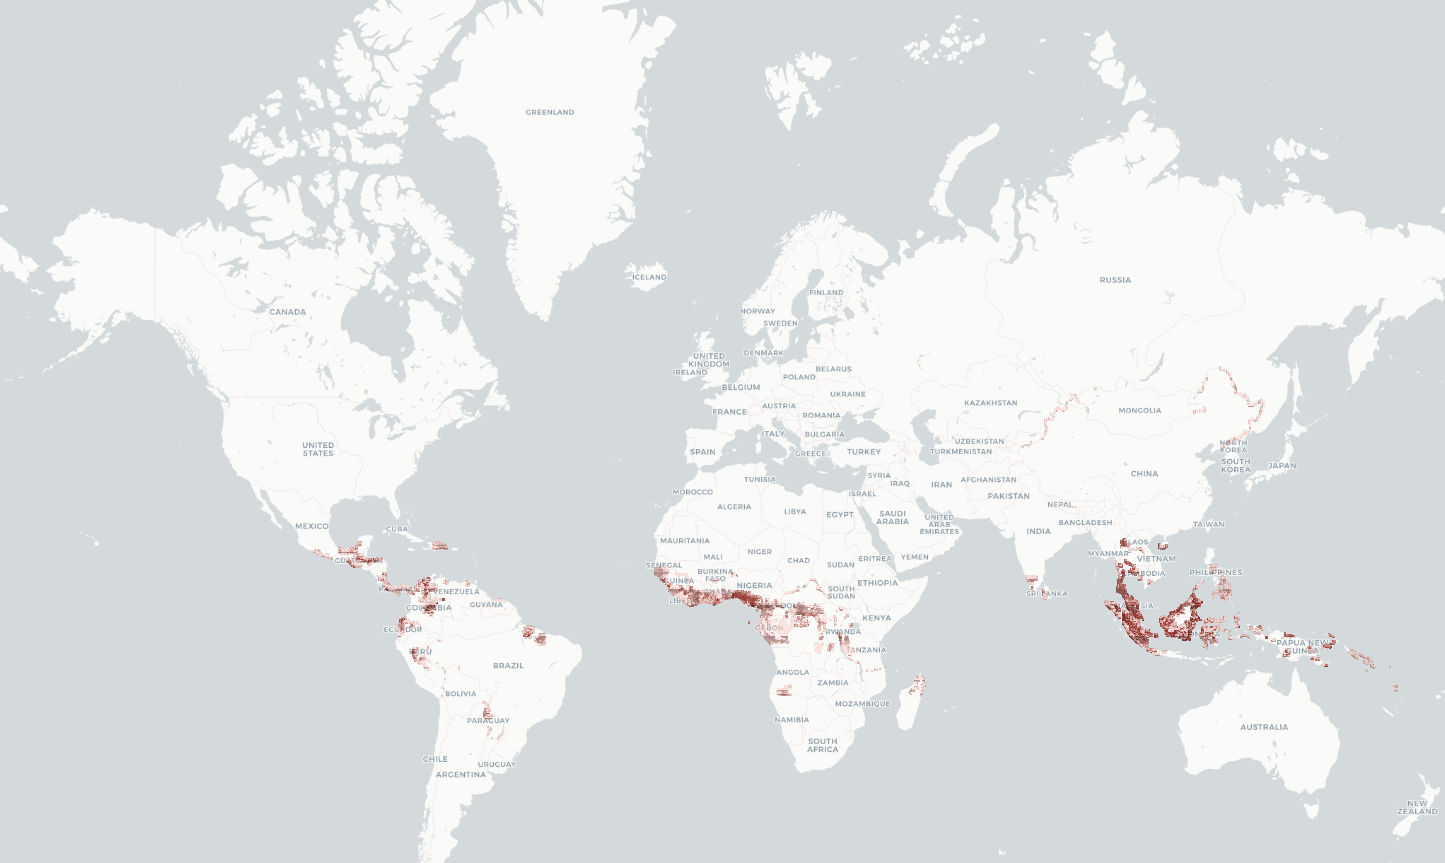
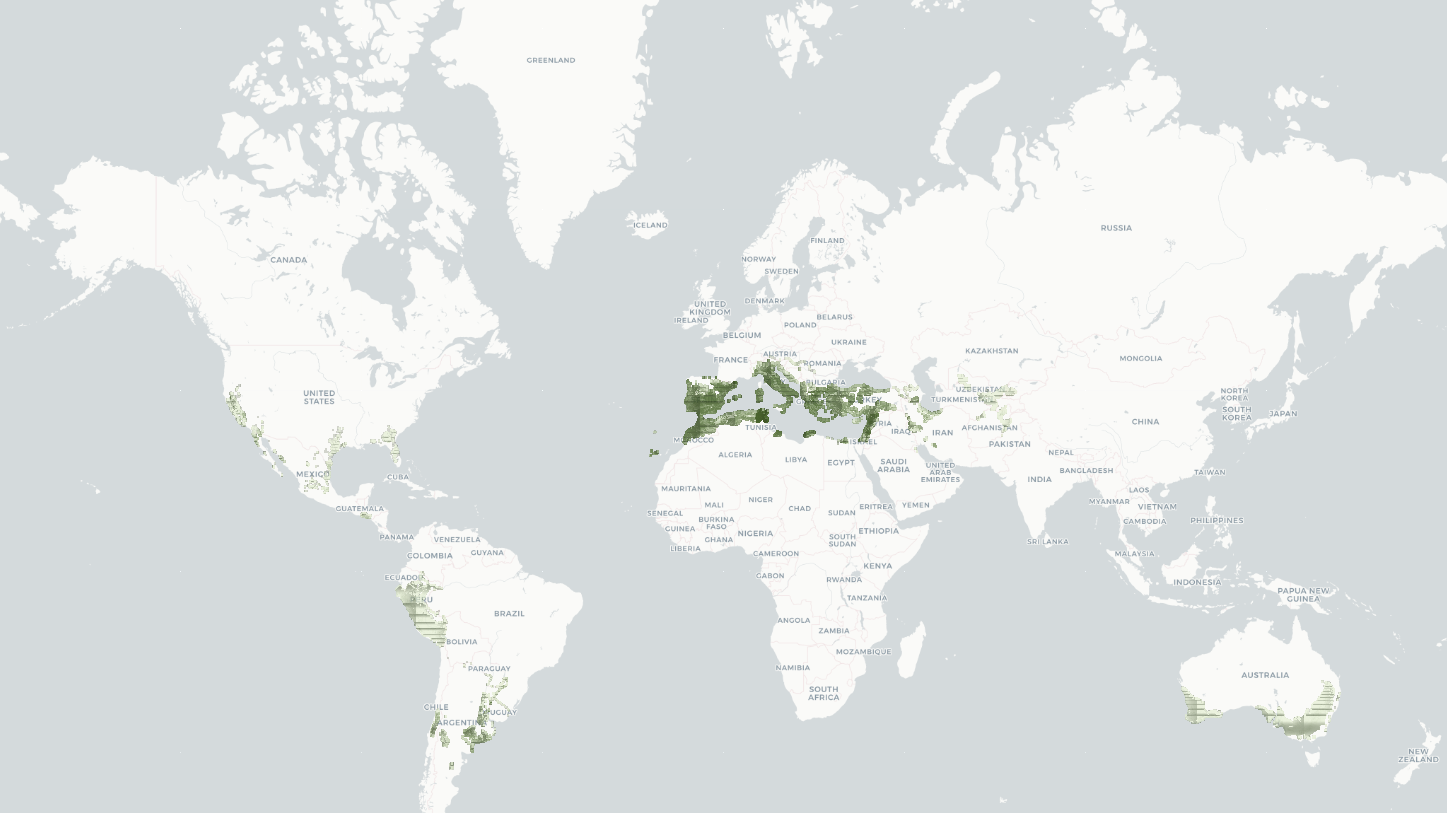
This makes broad crop patterns easier to compare and helps organizations identify where more focused investigation, sourcing assessment or higher-resolution geospatial work could begin. It demonstrates how complex public data can become accessible, decision-oriented insight.
Explore the data with Monopteryx
The interactive app is a practical demonstration of how the underlying grid files can be made accessible in a browser. It brings soybean, palm oil and olive data into one global map while allowing the user to focus on one crop at a time.
| Feature | What the user can do |
|---|---|
| Crop selection | Switch between soybean, oil palm and olive while keeping the analysis focused on one crop at a time |
| Area measure | Compare annual harvested area with physical crop area |
| Background maps | Select OpenStreetMap, Esri World Imagery or CartoDB Positron |
| Map navigation | Zoom and pan smoothly while the crop layer remains geographically aligned with the background |
| Native grid display | Explore the source data at its original 0.05° grid resolution |
| Cell inspection | Enable values on hover to inspect the selected area measure for individual grid cells |
Together, these controls make it easier to explore regional patterns and decide where a more tailored geospatial assessment could add value.
Monopteryx can adapt this analysis to a commodity, geography, or supply-chain question and combine public agricultural data with higher-resolution geospatial evidence.