Before satellites, models, or field-level maps can be useful, they need a baseline:
- which crops actually cover the planet’s farmland
- how much of each is grown
- how those totals are shifting from country to country over time
That baseline is the starting point for this series. Over the coming posts we will zoom into individual commodities and apply satellite intelligence to specific growing regions. This first post stays at the global level and asks a simpler question: according to official statistics, what are the biggest field crops and the biggest tree and perennial crops in the world, and how has their geography changed over the past decade?
The answer matters for anyone making decisions about agricultural supply chains, land use, or commodity risk. Procurement teams, sustainability officers, and agronomy consultants all rely, whether they realize it or not, on a shared statistical picture of world agriculture. That picture comes primarily from one source: the Food and Agriculture Organization’s FAOSTAT database. This post uses FAOSTAT’s most recent full reporting year to rank the world’s largest crop and tree types by harvested area and production, and then looks at a decade of country-level data to see where growth and contraction are actually happening. The goal is a clean, verifiable reference table that the rest of the series, and readers’ own analysis, can build on.
Data and Methods
All figures in this post come from FAOSTAT’s Production: Crops and Livestock Products dataset, the same bulk database that ministries, traders, and international organizations use for official crop statistics. We pulled two elements for every item in the dataset: area harvested and production, for the world total and for every individual reporting country, from 2000 through the latest available year.
Two cleaning steps were essential to get an honest ranking. First, FAOSTAT publishes both individual commodities (such as wheat or coffee) and aggregate categories that sum multiple commodities together (such as “Cereals, primary” or oil-equivalent totals). Aggregates and equivalent-weight categories were excluded so that each row in our ranking represents one actual crop, not a double-counted rollup. Second, the raw dataset mixes plant commodities with livestock and animal-product commodities under the same classification system; meat, dairy, eggs, hides, and similar categories were filtered out, leaving only plant crops.
We then split the remaining crops into two groups: annual field crops, which are replanted each season (cereals, oilseeds, pulses), and tree or perennial crops, which occupy the same land for many years or decades (palms, rubber, coffee, cocoa, and similar woody or long-cycle plants). This distinction matters operationally: field crops can shift between regions from one season to the next, while tree crops represent long-term land-use commitments that are far slower to relocate.
For the country-level comparison, we covered all ten field crops and all ten tree crops from the tables above, then for each one identified the ten countries with the largest harvested area in 2024 and compared each country’s area against 2015, a ten-year window. Each country-crop pair was classified as an increase if area grew by more than 3 percent, a decrease if it fell by more than 3 percent, or unchanged if the move was inside that band, a band chosen to separate genuine expansion or contraction from ordinary year-to-year reporting noise. For country-level statistics we also excluded FAO’s regional and income-group aggregates, along with a handful of dissolved or superseded political entities, so that every row represents a real, currently reporting country. One caveat worth flagging: 2024 is FAOSTAT’s most recent bulk-archive year and country/item coverage for it is measurably thinner than for 2023 in the raw data (397 vs. 450 item-rows at the world level, roughly 27,006 vs. 30,550 country-item-year rows), which is also why 2025 figures are not yet published, so 2024 values throughout this post should be read as provisional.
Results
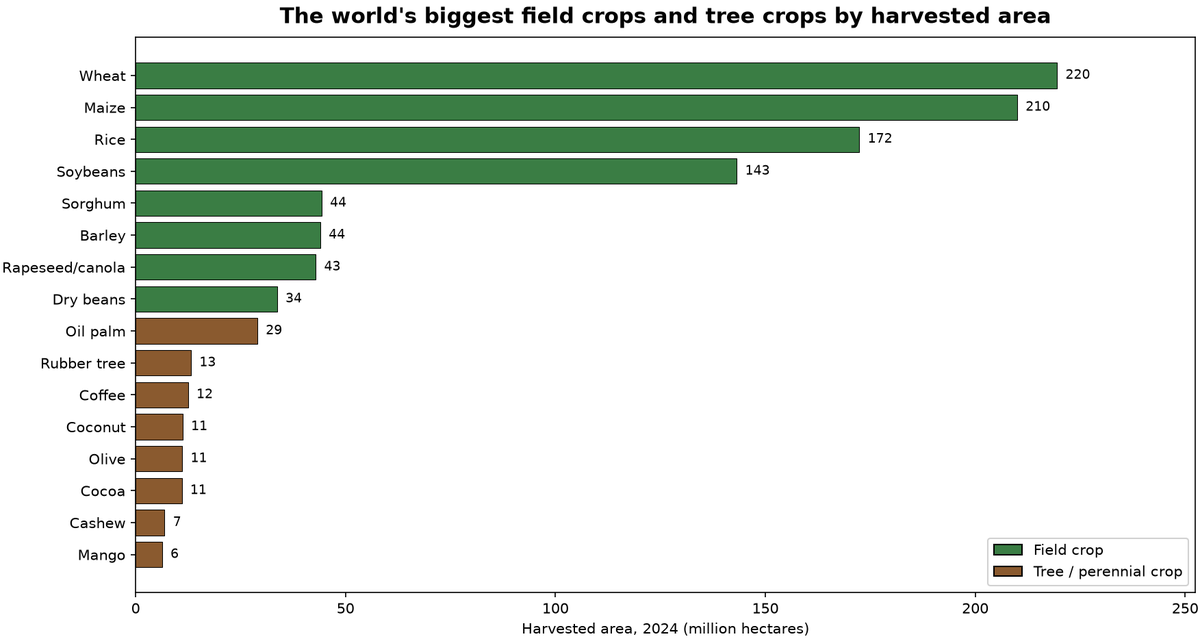
By harvested area, three cereals dominate global field-crop land: wheat, maize, and rice together account for roughly 600 million hectares, an area larger than the entire European Union. Soybeans rank fourth, ahead of sorghum, barley, rapeseed, dry beans, groundnuts, and cotton.
| Rank | Field crop | Area harvested (Mha) | Production (Mt) |
|---|---|---|---|
| 1 | Wheat | 219.5 | 798.5 |
| 2 | Maize | 210.0 | 1,218.2 |
| 3 | Rice | 172.4 | 820.2 |
| 4 | Soybeans | 143.2 | 397.7 |
| 5 | Sorghum | 44.3 | 64.3 |
| 6 | Barley | 44.0 | 142.0 |
| 7 | Rapeseed/canola | 42.9 | 87.9 |
| 8 | Dry beans | 33.7 | 30.3 |
| 9 | Groundnuts | 31.2 | 57.6 |
| 10 | Cotton | 30.8 | 72.8 |
Among tree and perennial crops, the ranking looks quite different, both in scale and in composition. Oil palm alone covers more area than any single tree crop by a large margin, and its production tonnage is an order of magnitude higher than any other tree crop, a reflection of exceptionally high yields per hectare. Grapes and bananas round out the top ten; both are technically a vine and a large herbaceous plant rather than literal trees, but we classify them here as tree/perennial crops because, like oil palm or coffee, they occupy the same land for years or decades rather than being replanted each season — the same operational distinction this post uses throughout.
| Rank | Tree / perennial crop | Area harvested (Mha) | Production (Mt) |
|---|---|---|---|
| 1 | Oil palm | 29.0 | 418.7 |
| 2 | Rubber tree | 13.2 | 14.8 |
| 3 | Coffee | 12.5 | 11.3 |
| 4 | Coconut | 11.2 | 65.5 |
| 5 | Olive | 11.1 | 25.6 |
| 6 | Cocoa | 11.0 | 5.2 |
| 7 | Cashew | 6.9 | 4.2 |
| 8 | Grapes | 6.7 | 75.9 |
| 9 | Mango | 6.3 | 62.2 |
| 10 | Bananas | 5.9 | 139.4 |
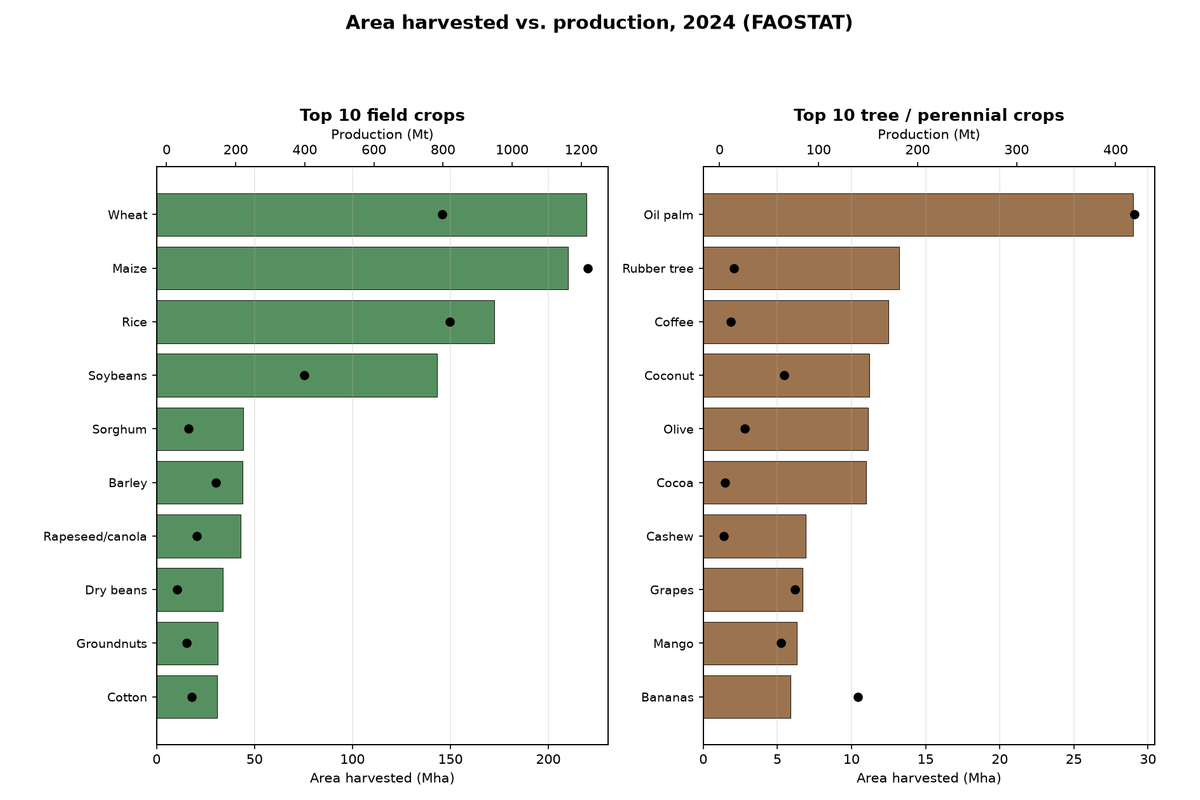
Comparing area to production side by side highlights a pattern worth remembering throughout this series: harvested area and production do not move together. Maize occupies less land than wheat but produces roughly 50 percent more tonnage, and oil palm produces more than five times the tonnage of coconut from roughly two and a half times the area. Area tells you where the land pressure is; production tells you where the volume is. Both matter for different kinds of business decisions.
Global totals, though, can hide as much as they reveal: a stable world total can mask sharp gains in some countries fully offset by losses in others. To see where the real movement is happening, we tracked harvested area country by country for every crop in the two tables above, comparing each of the ten leading producers in 2015 against 2024 and classifying the move as an increase, a decrease, or unchanged. Wheat, maize, and rice illustrate the range of outcomes best (the chart below still focuses on the top 5 countries per crop for readability; the full top-10 breakdown is in the tabs further down):
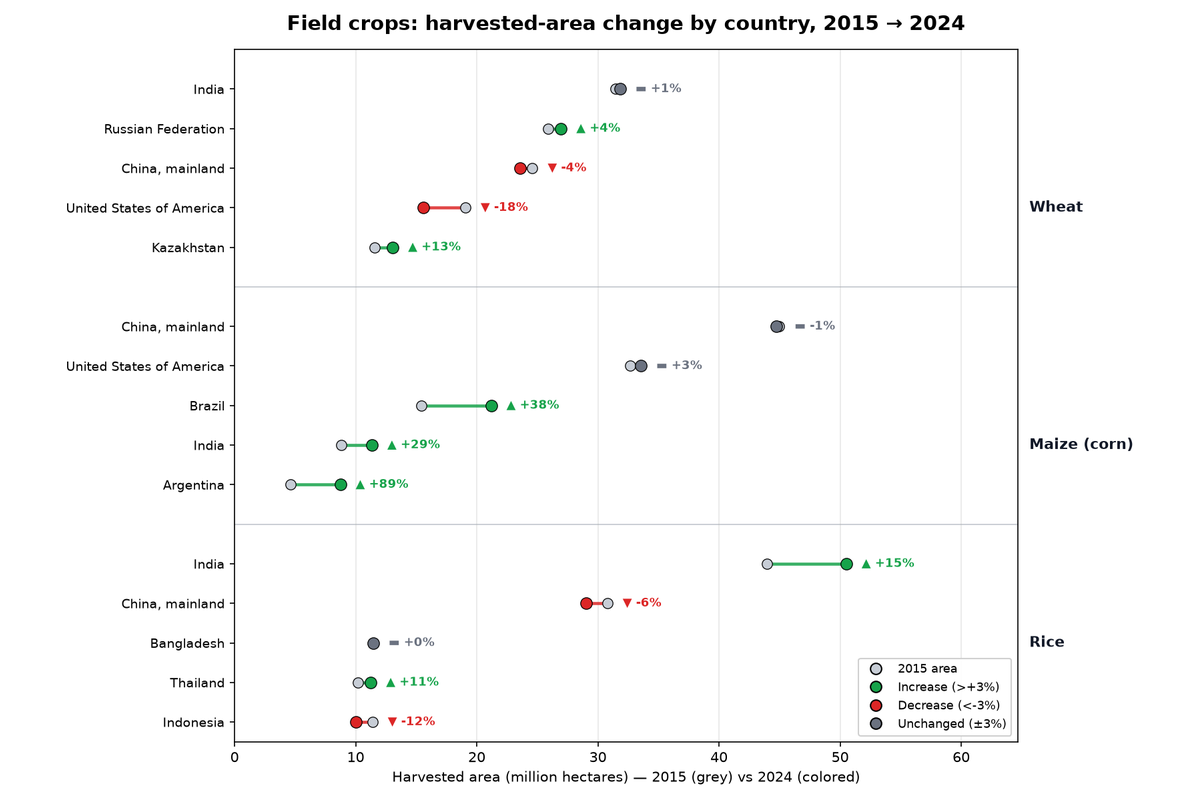
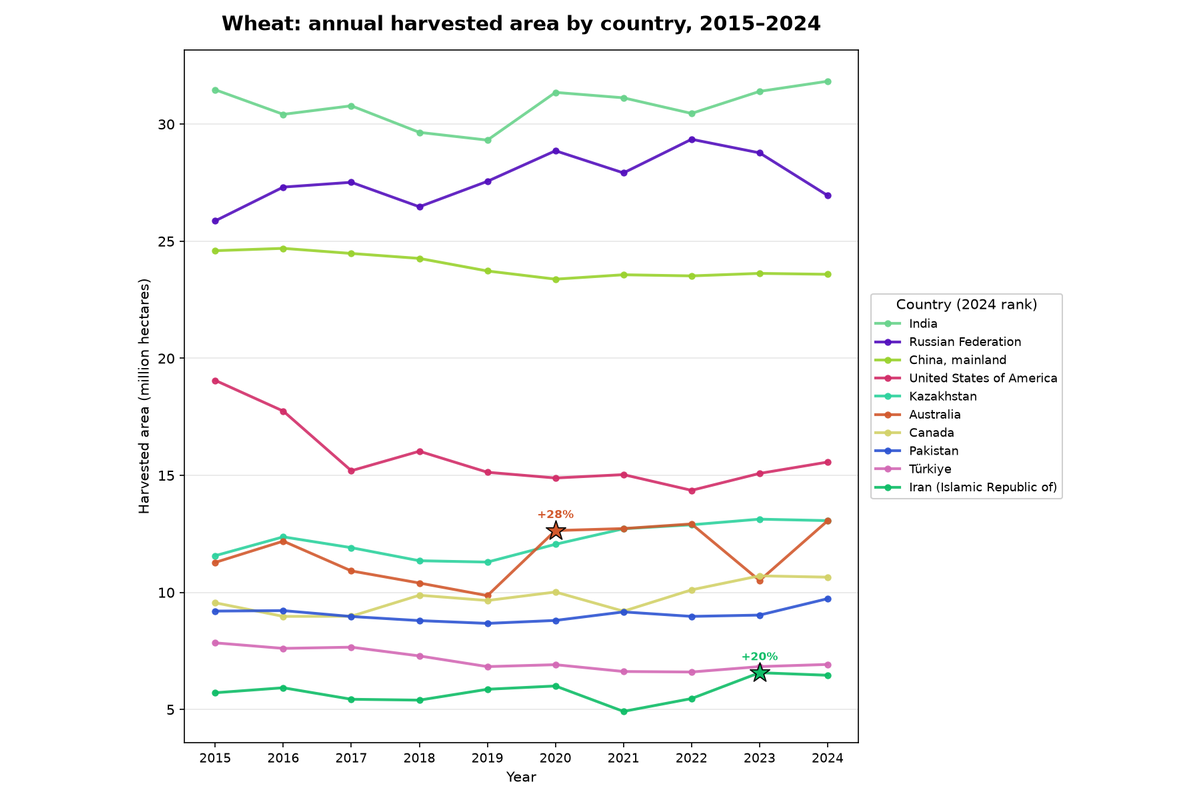
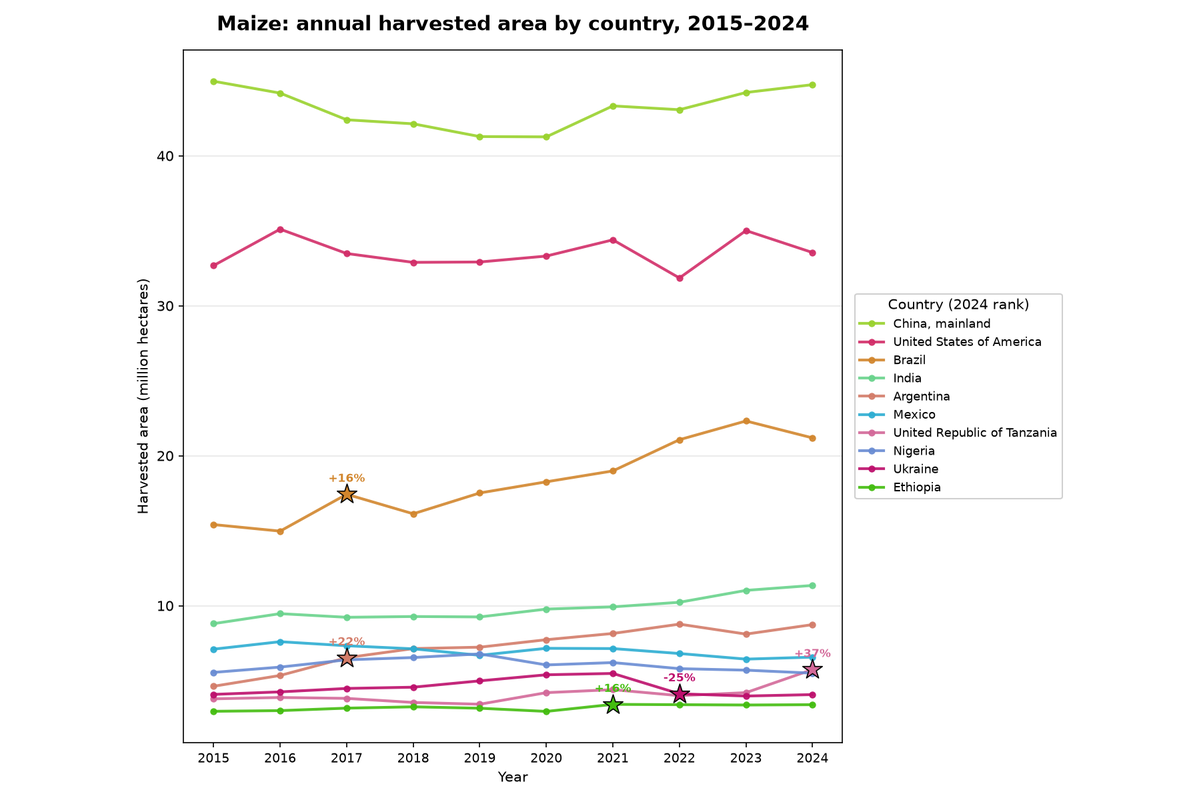
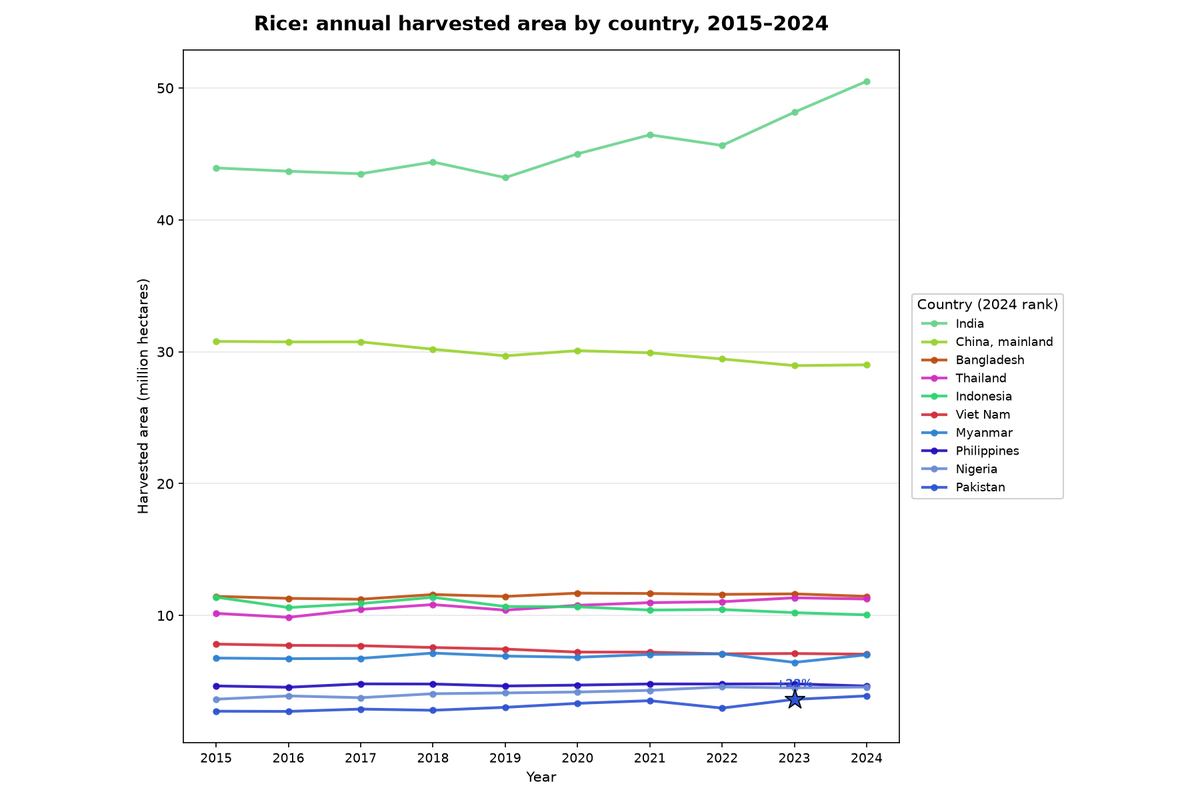
Wheat area held essentially flat in the world’s largest producer, India (+1 percent), and grew in Russia (+4 percent) and Kazakhstan (+13 percent), while China’s mainland (-4 percent) and, most sharply, the United States (-18 percent) contracted. Maize tells a different story: China and the United States, the two largest producers, were essentially unchanged, but Brazil (+38 percent), India (+29 percent), and Argentina (+89 percent) all expanded meaningfully, with Argentina nearly doubling its maize area over the decade. Rice area grew fastest in India (+15 percent) and Thailand (+11 percent), while China’s mainland (-6 percent) and Indonesia (-12 percent) contracted, and Bangladesh stayed essentially flat.
The same country-level breakdown for all ten field crops is below — select a crop to see its ten leading countries.
| Country | 2015 (Mha) | 2024 (Mha) | Change | Trend |
|---|---|---|---|---|
| India | 31.47 | 31.83 | +1.1% | ▬ Unchanged |
| Russian Federation | 25.87 | 26.95 | +4.2% | ▲ Increase |
| China, mainland | 24.60 | 23.59 | -4.1% | ▼ Decrease |
| United States of America | 19.06 | 15.57 | -18.3% | ▼ Decrease |
| Kazakhstan | 11.57 | 13.07 | +12.9% | ▲ Increase |
| Australia | 11.28 | 13.06 | +15.8% | ▲ Increase |
| Canada | 9.56 | 10.65 | +11.4% | ▲ Increase |
| Pakistan | 9.20 | 9.73 | +5.8% | ▲ Increase |
| Türkiye | 7.85 | 6.92 | -11.7% | ▼ Decrease |
| Iran (Islamic Republic of) | 5.72 | 6.46 | +13.1% | ▲ Increase |
| Country | 2015 (Mha) | 2024 (Mha) | Change | Trend |
|---|---|---|---|---|
| China, mainland | 44.97 | 44.74 | -0.5% | ▬ Unchanged |
| United States of America | 32.68 | 33.55 | +2.7% | ▬ Unchanged |
| Brazil | 15.41 | 21.19 | +37.5% | ▲ Increase |
| India | 8.80 | 11.35 | +28.9% | ▲ Increase |
| Argentina | 4.63 | 8.74 | +88.8% | ▲ Increase |
| Mexico | 7.10 | 6.57 | -7.5% | ▼ Decrease |
| United Republic of Tanzania | 3.79 | 5.74 | +51.6% | ▲ Increase |
| Nigeria | 5.55 | 5.50 | -0.9% | ▬ Unchanged |
| Ukraine | 4.08 | 4.07 | -0.3% | ▬ Unchanged |
| Ethiopia | 2.96 | 3.40 | +14.9% | ▲ Increase |
| Country | 2015 (Mha) | 2024 (Mha) | Change | Trend |
|---|---|---|---|---|
| India | 43.94 | 50.51 | +15.0% | ▲ Increase |
| China, mainland | 30.78 | 29.01 | -5.8% | ▼ Decrease |
| Bangladesh | 11.45 | 11.45 | +0.0% | ▬ Unchanged |
| Thailand | 10.16 | 11.25 | +10.7% | ▲ Increase |
| Indonesia | 11.39 | 10.05 | -11.8% | ▼ Decrease |
| Viet Nam | 7.83 | 7.06 | -9.8% | ▼ Decrease |
| Myanmar | 6.77 | 7.02 | +3.6% | ▲ Increase |
| Philippines | 4.66 | 4.65 | -0.2% | ▬ Unchanged |
| Nigeria | 3.65 | 4.57 | +25.2% | ▲ Increase |
| Pakistan | 2.74 | 3.90 | +42.3% | ▲ Increase |
| Country | 2015 (Mha) | 2024 (Mha) | Change | Trend |
|---|---|---|---|---|
| Brazil | 32.18 | 45.91 | +42.6% | ▲ Increase |
| United States of America | 33.12 | 34.82 | +5.1% | ▲ Increase |
| Argentina | 19.35 | 16.37 | -15.4% | ▼ Decrease |
| India | 11.61 | 12.94 | +11.5% | ▲ Increase |
| China, mainland | 6.51 | 10.32 | +58.6% | ▲ Increase |
| Russian Federation | 2.08 | 4.13 | +98.1% | ▲ Increase |
| Paraguay | 3.54 | 3.65 | +3.1% | ▲ Increase |
| Ukraine | 2.14 | 2.71 | +27.1% | ▲ Increase |
| Canada | 2.23 | 2.29 | +2.6% | ▬ Unchanged |
| Bolivia (Plurinational State of) | 1.32 | 1.69 | +27.4% | ▲ Increase |
| Country | 2015 (Mha) | 2024 (Mha) | Change | Trend |
|---|---|---|---|---|
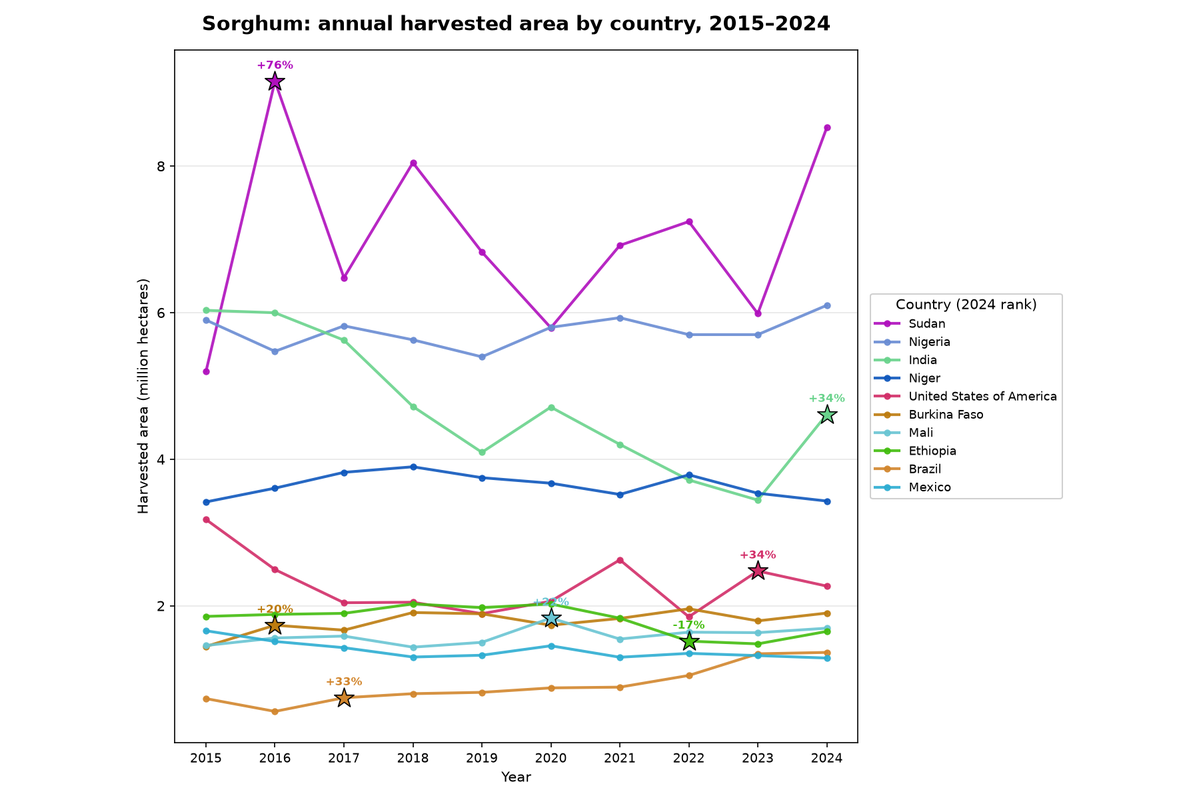
| Sudan | 5.20 | 8.53 | +64.0% | ▲ Increase |
| Nigeria | 5.90 | 6.10 | +3.4% | ▲ Increase |
| India | 6.03 | 4.61 | -23.5% | ▼ Decrease |
| Niger | 3.42 | 3.43 | +0.4% | ▬ Unchanged |
| United States of America | 3.18 | 2.27 | -28.6% | ▼ Decrease |
| Burkina Faso | 1.45 | 1.90 | +31.5% | ▲ Increase |
| Mali | 1.46 | 1.69 | +16.2% | ▲ Increase |
| Ethiopia | 1.85 | 1.65 | -11.0% | ▼ Decrease |
| Brazil | 0.73 | 1.36 | +86.0% | ▲ Increase |
| Mexico | 1.66 | 1.29 | -22.4% | ▼ Decrease |
| Country | 2015 (Mha) | 2024 (Mha) | Change | Trend |
|---|---|---|---|---|
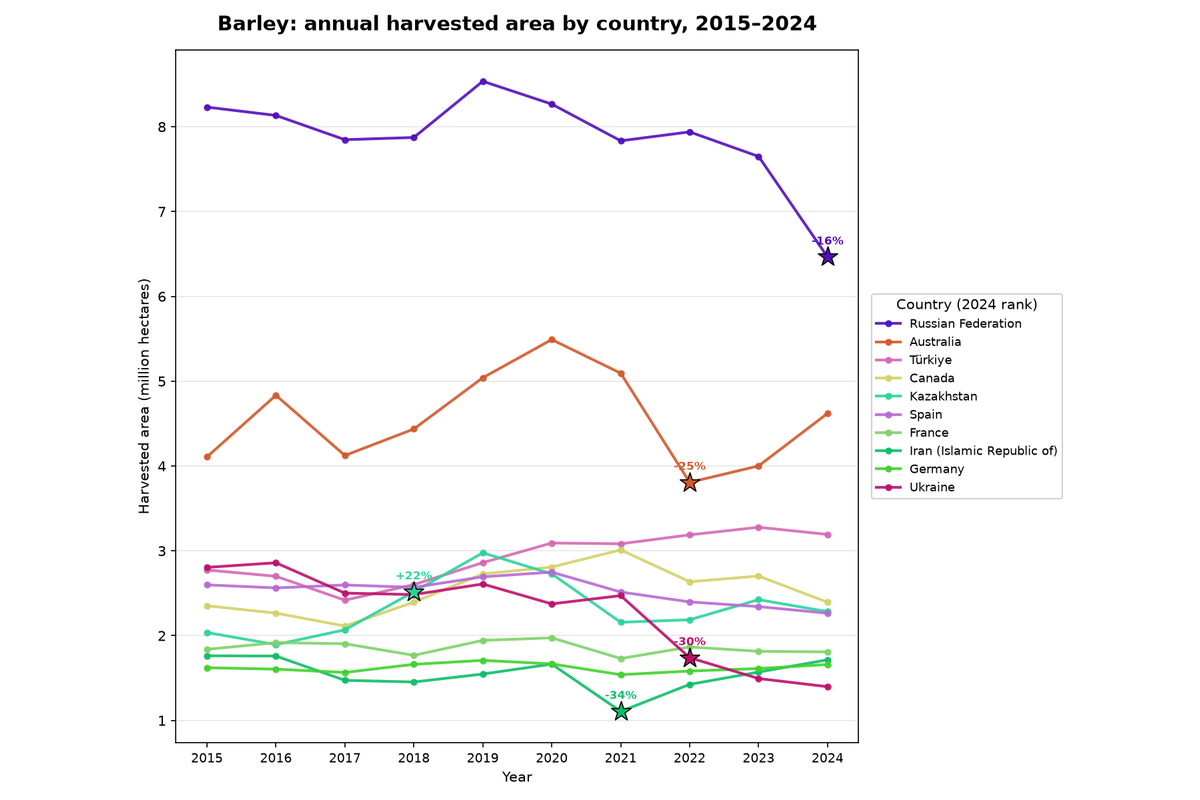
| Russian Federation | 8.23 | 6.46 | -21.5% | ▼ Decrease |
| Australia | 4.11 | 4.62 | +12.5% | ▲ Increase |
| Türkiye | 2.77 | 3.19 | +15.1% | ▲ Increase |
| Canada | 2.35 | 2.39 | +1.8% | ▬ Unchanged |
| Kazakhstan | 2.04 | 2.28 | +12.1% | ▲ Increase |
| Spain | 2.60 | 2.26 | -12.9% | ▼ Decrease |
| France | 1.84 | 1.81 | -1.6% | ▬ Unchanged |
| Iran (Islamic Republic of) | 1.76 | 1.72 | -2.7% | ▬ Unchanged |
| Germany | 1.62 | 1.66 | +2.4% | ▬ Unchanged |
| Ukraine | 2.81 | 1.40 | -50.2% | ▼ Decrease |
| Country | 2015 (Mha) | 2024 (Mha) | Change | Trend |
|---|---|---|---|---|
| India | 5.79 | 9.18 | +58.6% | ▲ Increase |
| Canada | 8.36 | 8.85 | +5.8% | ▲ Increase |
| China, mainland | 7.03 | 7.90 | +12.5% | ▲ Increase |
| Australia | 2.09 | 3.44 | +64.5% | ▲ Increase |
| Russian Federation | 0.90 | 2.61 | +188.9% | ▲ Increase |
| France | 1.51 | 1.33 | -11.9% | ▼ Decrease |
| Ukraine | 0.67 | 1.26 | +87.8% | ▲ Increase |
| United States of America | 0.69 | 1.10 | +58.9% | ▲ Increase |
| Germany | 1.29 | 1.09 | -15.3% | ▼ Decrease |
| Poland | 0.95 | 1.01 | +6.6% | ▲ Increase |
| Country | 2015 (Mha) | 2024 (Mha) | Change | Trend |
|---|---|---|---|---|
| India | 10.21 | 11.71 | +14.7% | ▲ Increase |
| Brazil | 2.87 | 2.63 | -8.2% | ▼ Decrease |
| Myanmar | 3.29 | 2.55 | -22.7% | ▼ Decrease |
| Mexico | 1.55 | 1.37 | -12.2% | ▼ Decrease |
| Kenya | 1.24 | 1.23 | -1.1% | ▬ Unchanged |
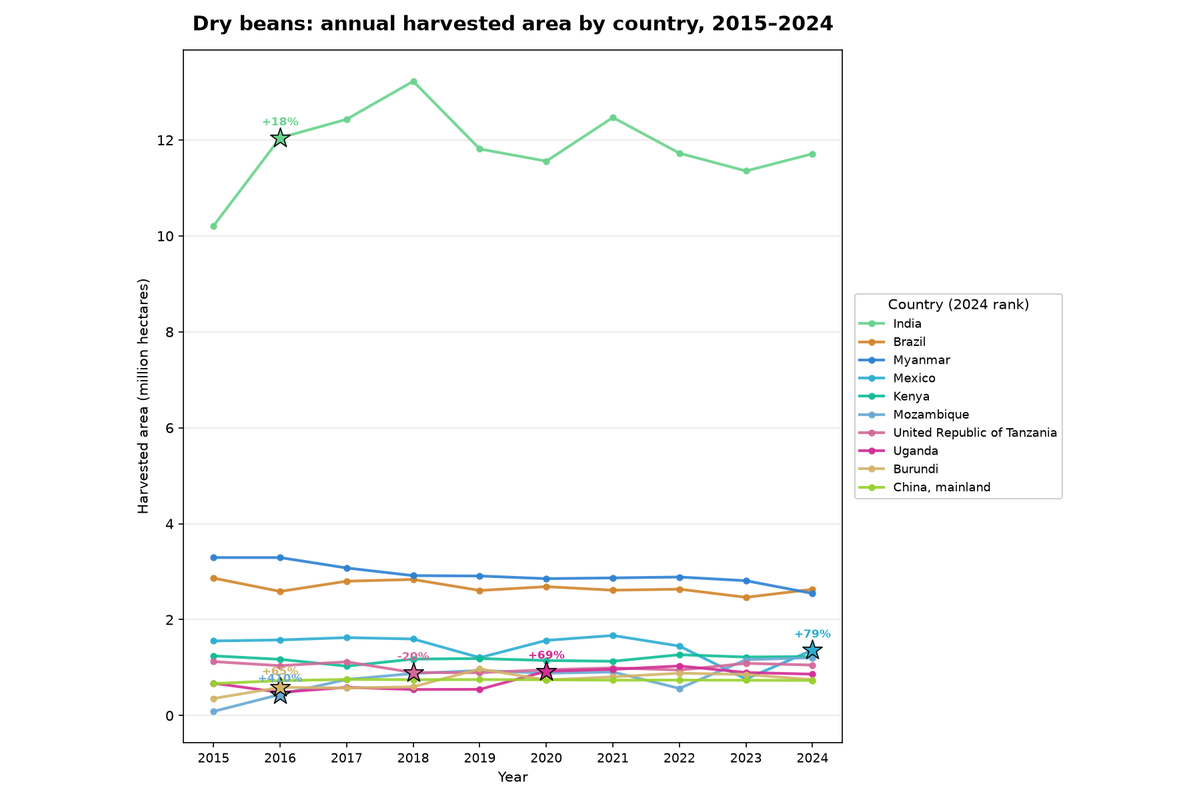
| Mozambique | 0.09 | 1.21 | +1299.1% | ▲ Increase |
| United Republic of Tanzania | 1.12 | 1.05 | -6.4% | ▼ Decrease |
| Uganda | 0.68 | 0.86 | +27.9% | ▲ Increase |
| Burundi | 0.36 | 0.75 | +110.2% | ▲ Increase |
| China, mainland | 0.67 | 0.73 | +9.9% | ▲ Increase |
| Country | 2015 (Mha) | 2024 (Mha) | Change | Trend |
|---|---|---|---|---|
| India | 4.59 | 5.66 | +23.1% | ▲ Increase |
| China, mainland | 4.39 | 4.86 | +10.7% | ▲ Increase |
| Nigeria | 2.80 | 3.45 | +23.1% | ▲ Increase |
| Sudan | 1.47 | 2.45 | +67.2% | ▲ Increase |
| Senegal | 1.14 | 1.27 | +11.7% | ▲ Increase |
| Myanmar | 0.95 | 1.23 | +29.5% | ▲ Increase |
| Niger | 0.72 | 1.04 | +45.2% | ▲ Increase |
| United Republic of Tanzania | 1.62 | 0.95 | -41.5% | ▼ Decrease |
| Guinea | 0.61 | 0.88 | +43.7% | ▲ Increase |
| Chad | 0.58 | 0.76 | +30.9% | ▲ Increase |
| Country | 2015 (Mha) | 2024 (Mha) | Change | Trend |
|---|---|---|---|---|
| India | 11.87 | 11.45 | -3.6% | ▼ Decrease |
| United States of America | 3.27 | 3.35 | +2.4% | ▬ Unchanged |
| China, mainland | 3.77 | 2.84 | -24.6% | ▼ Decrease |
| Pakistan | 2.90 | 2.04 | -29.6% | ▼ Decrease |
| Brazil | 1.03 | 1.99 | +92.7% | ▲ Increase |
| Uzbekistan | 1.30 | 0.96 | -25.9% | ▼ Decrease |
| Burkina Faso | 0.56 | 0.65 | +16.9% | ▲ Increase |
| Mali | 0.55 | 0.62 | +14.2% | ▲ Increase |
| Argentina | 0.46 | 0.62 | +36.5% | ▲ Increase |
| Nigeria | 0.40 | 0.59 | +46.7% | ▲ Increase |
Tree crops show a starker pattern: unlike field crops, where gains and losses roughly offset, growth was close to universal.
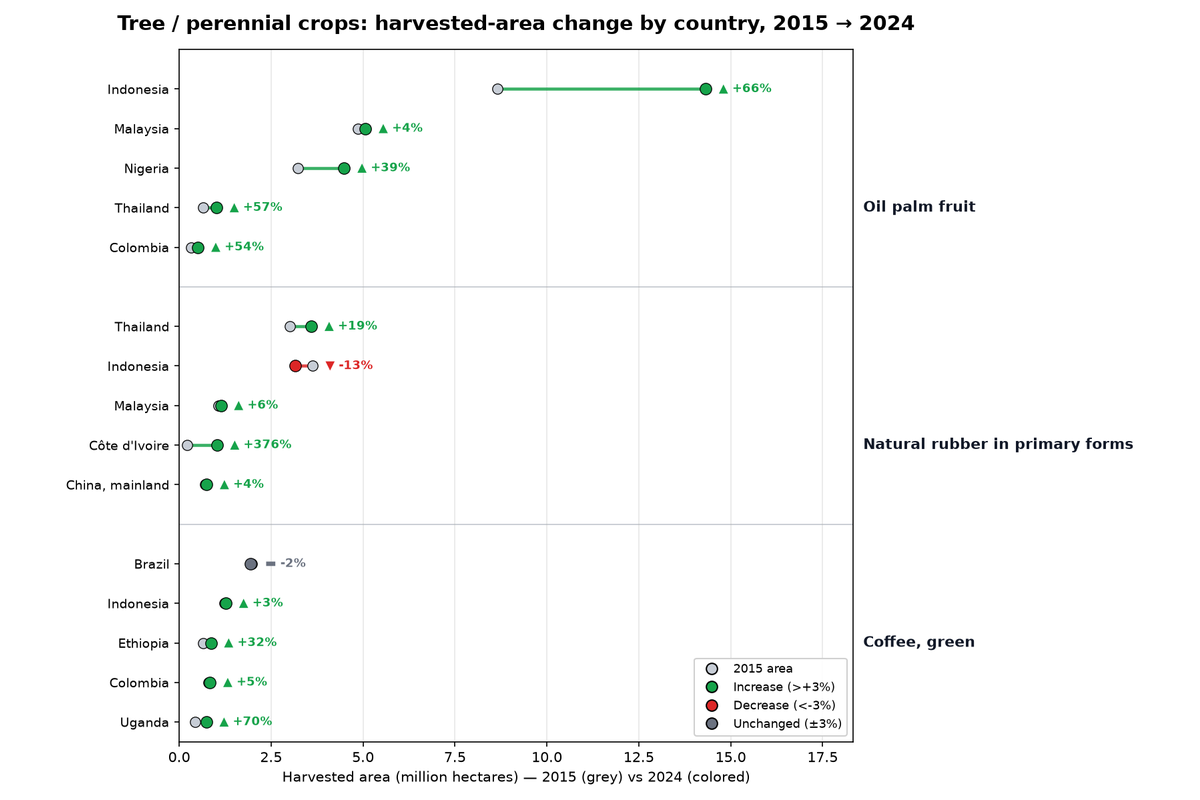
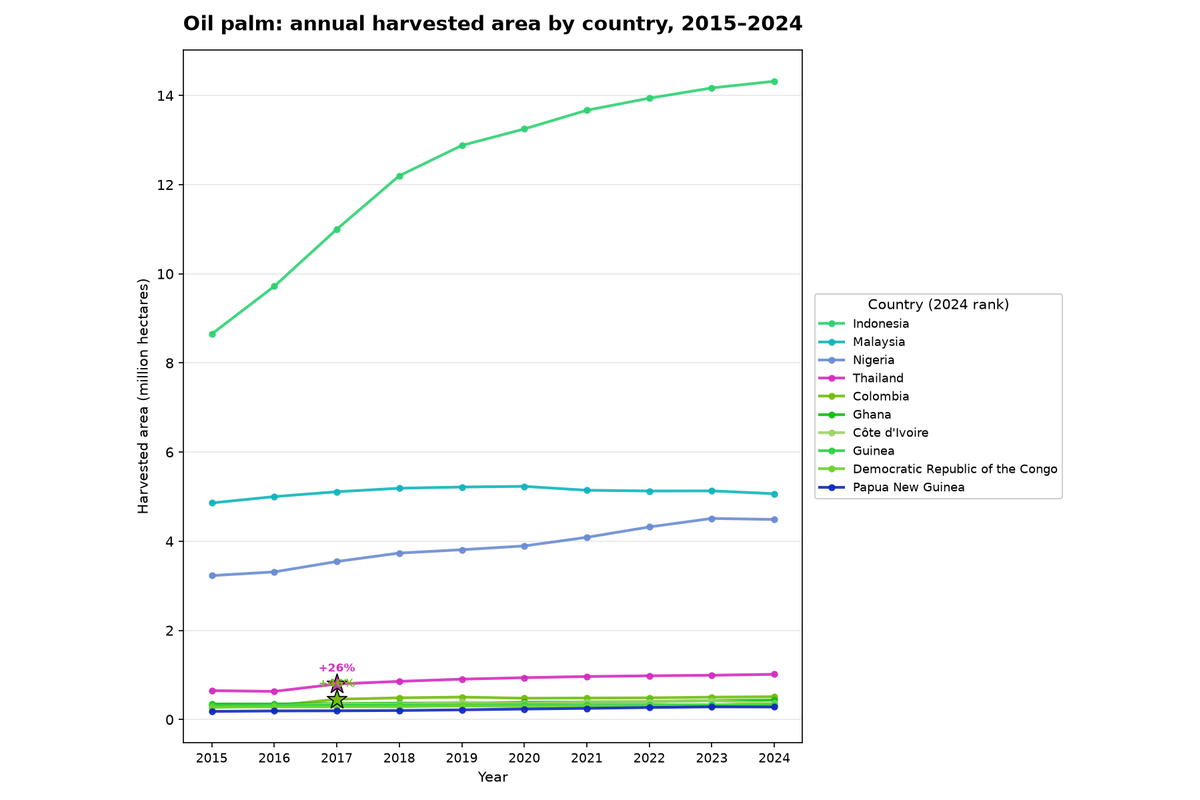
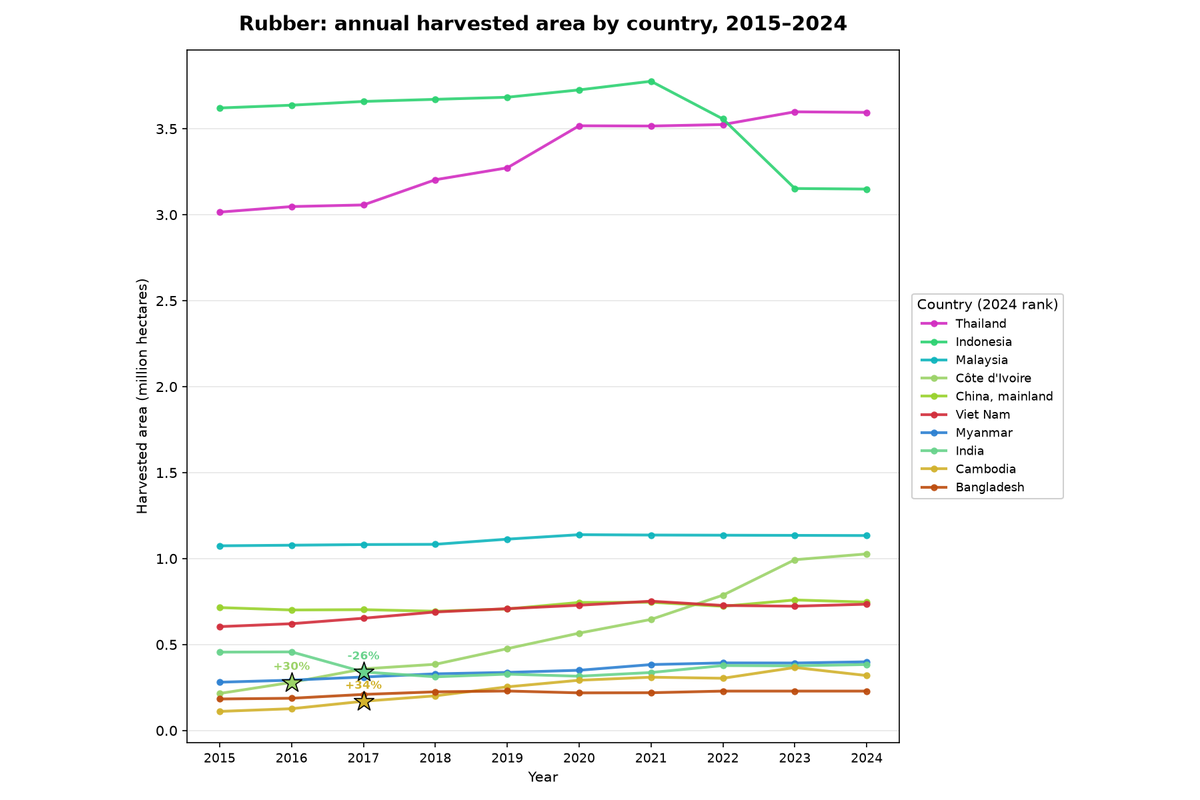
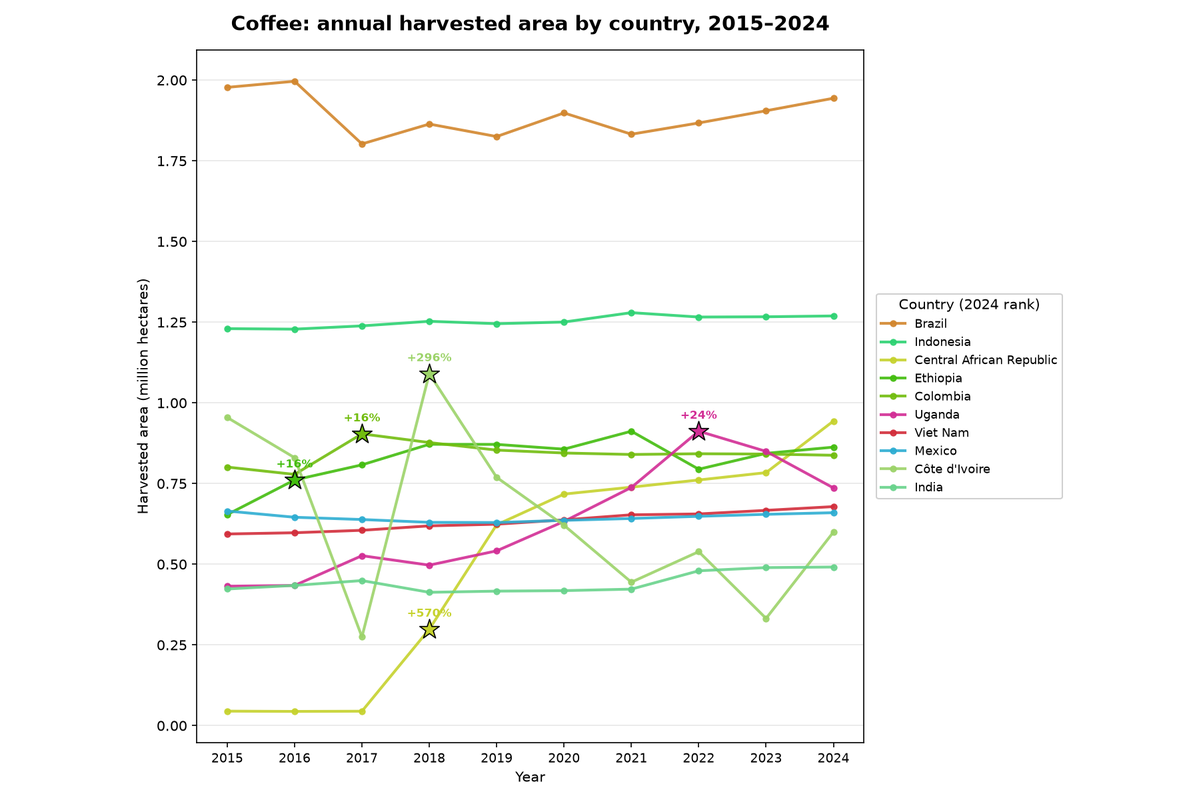
Every one of the five largest oil palm producers expanded. Indonesia added 5.7 million hectares (+66 percent), by far the largest single move in either table, while Malaysia, Nigeria, Thailand, and Colombia all grew as well, from a low double digits to more than 50 percent. Rubber shows more divergence: Thailand (+19 percent), Malaysia (+6 percent), and China’s mainland (+4 percent) grew modestly, Indonesia contracted (-13 percent), and Côte d’Ivoire’s rubber area more than quadrupled (+376 percent) as West African production has expanded rapidly over the past decade. Coffee area grew in four of the five leading producers, most notably Uganda (+70 percent) and Ethiopia (+32 percent), while Brazil, the largest producer, stayed essentially flat (-2 percent).
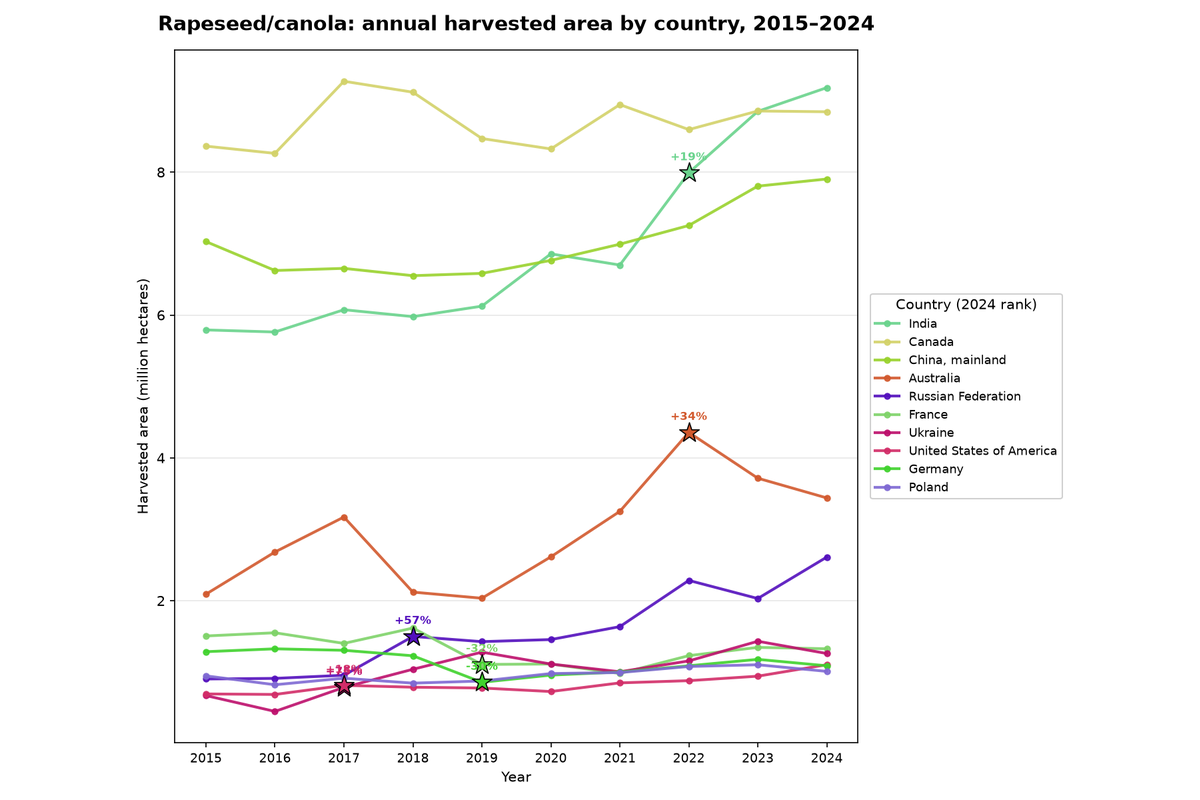
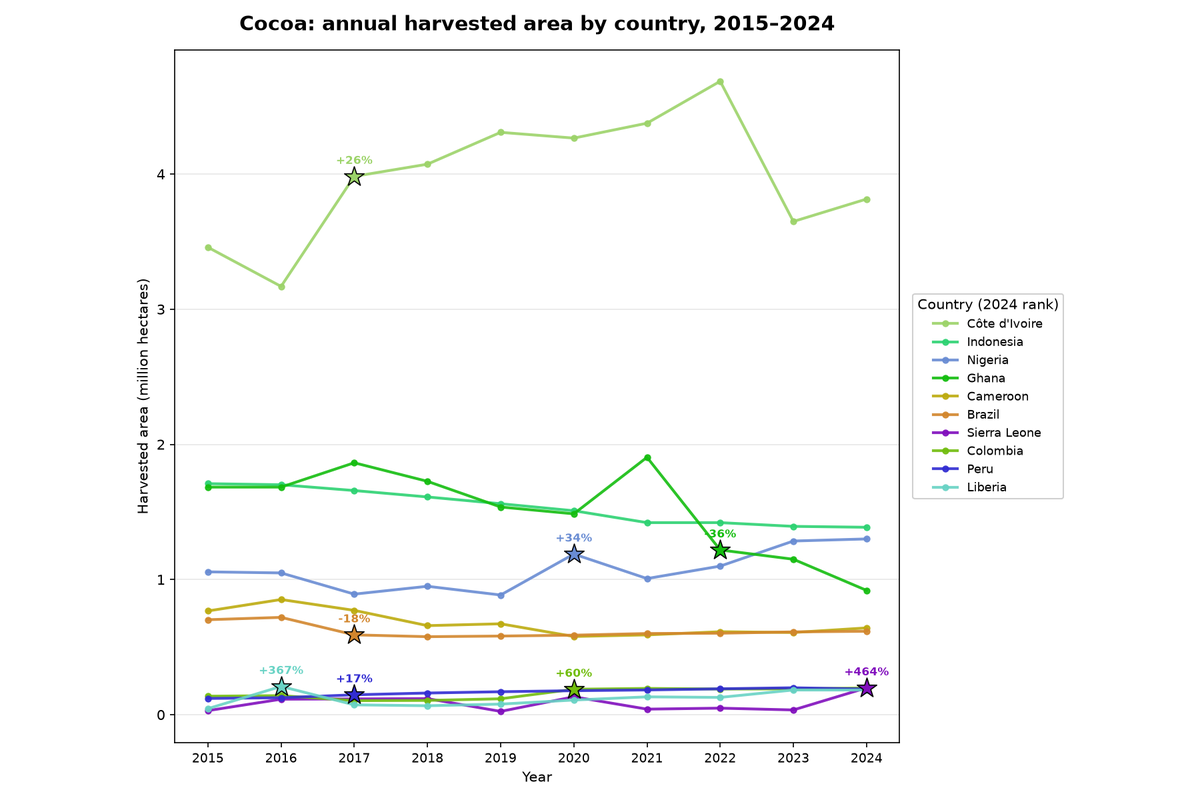
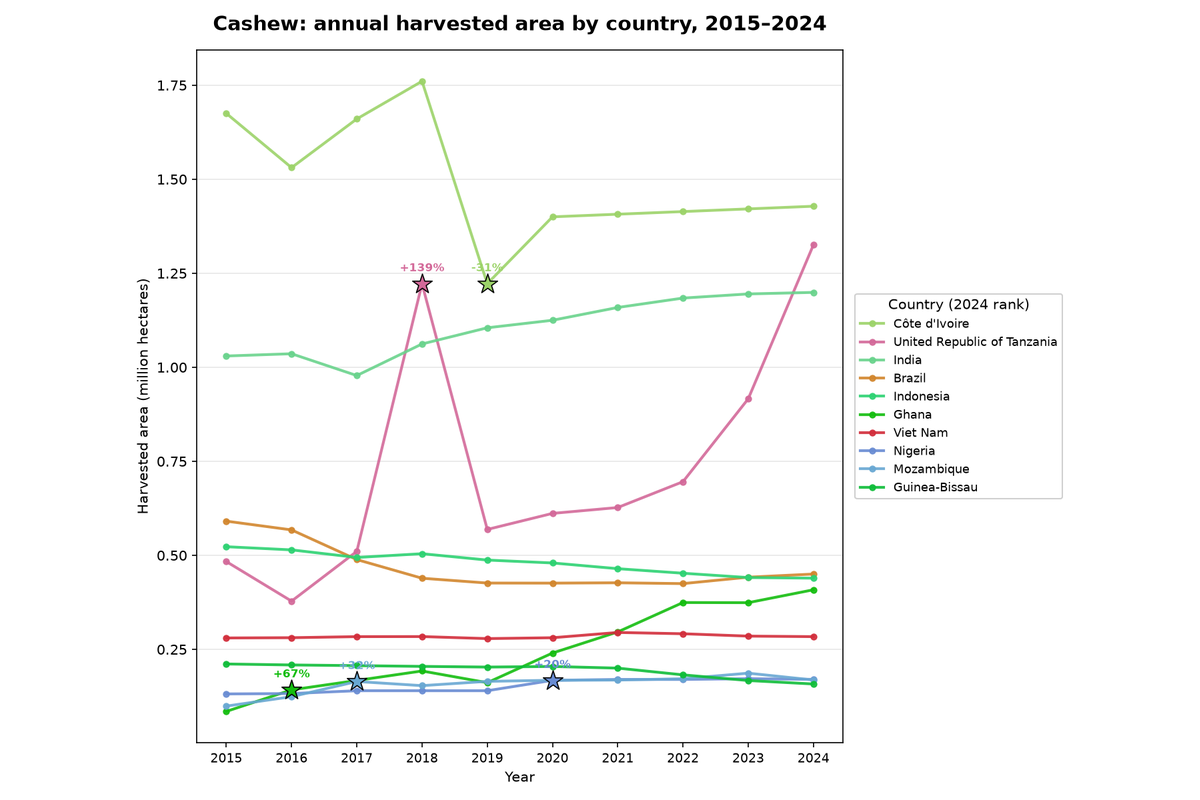
Beyond these three, some of the sharpest moves in the whole dataset show up in crops with a smaller footprint: Ghana’s cocoa area fell 45 percent as aging trees and swollen shoot virus took a toll, Russia’s rapeseed area nearly tripled (+189 percent), and Tanzania’s cashew area grew 174 percent on the back of a government-backed planting push. The full country-level breakdown for all ten tree and perennial crops is below.
| Country | 2015 (Mha) | 2024 (Mha) | Change | Trend |
|---|---|---|---|---|
| Indonesia | 8.65 | 14.32 | +65.5% | ▲ Increase |
| Malaysia | 4.86 | 5.07 | +4.3% | ▲ Increase |
| Nigeria | 3.23 | 4.49 | +39.0% | ▲ Increase |
| Thailand | 0.65 | 1.01 | +56.6% | ▲ Increase |
| Colombia | 0.33 | 0.51 | +53.6% | ▲ Increase |
| Ghana | 0.35 | 0.44 | +24.9% | ▲ Increase |
| Côte d'Ivoire | 0.27 | 0.36 | +31.2% | ▲ Increase |
| Guinea | 0.32 | 0.33 | +5.5% | ▲ Increase |
| Democratic Republic of the Congo | 0.28 | 0.30 | +6.8% | ▲ Increase |
| Papua New Guinea | 0.18 | 0.28 | +54.4% | ▲ Increase |
| Country | 2015 (Mha) | 2024 (Mha) | Change | Trend |
|---|---|---|---|---|
| Thailand | 3.02 | 3.60 | +19.2% | ▲ Increase |
| Indonesia | 3.62 | 3.15 | -13.0% | ▼ Decrease |
| Malaysia | 1.07 | 1.13 | +5.6% | ▲ Increase |
| Côte d'Ivoire | 0.22 | 1.03 | +376.5% | ▲ Increase |
| China, mainland | 0.71 | 0.75 | +4.4% | ▲ Increase |
| Viet Nam | 0.60 | 0.73 | +21.6% | ▲ Increase |
| Myanmar | 0.28 | 0.40 | +42.3% | ▲ Increase |
| India | 0.46 | 0.38 | -15.8% | ▼ Decrease |
| Cambodia | 0.11 | 0.32 | +187.4% | ▲ Increase |
| Bangladesh | 0.18 | 0.23 | +25.0% | ▲ Increase |
| Country | 2015 (Mha) | 2024 (Mha) | Change | Trend |
|---|---|---|---|---|
| Brazil | 1.98 | 1.94 | -1.7% | ▬ Unchanged |
| Indonesia | 1.23 | 1.27 | +3.2% | ▲ Increase |
| Central African Republic | 0.04 | 0.94 | +2006.6% | ▲ Increase |
| Ethiopia | 0.65 | 0.86 | +32.0% | ▲ Increase |
| Colombia | 0.80 | 0.84 | +4.6% | ▲ Increase |
| Uganda | 0.43 | 0.74 | +70.5% | ▲ Increase |
| Viet Nam | 0.59 | 0.68 | +14.3% | ▲ Increase |
| Mexico | 0.67 | 0.66 | -0.8% | ▬ Unchanged |
| Côte d'Ivoire | 0.95 | 0.60 | -37.2% | ▼ Decrease |
| India | 0.42 | 0.49 | +16.1% | ▲ Increase |
| Country | 2015 (Mha) | 2024 (Mha) | Change | Trend |
|---|---|---|---|---|
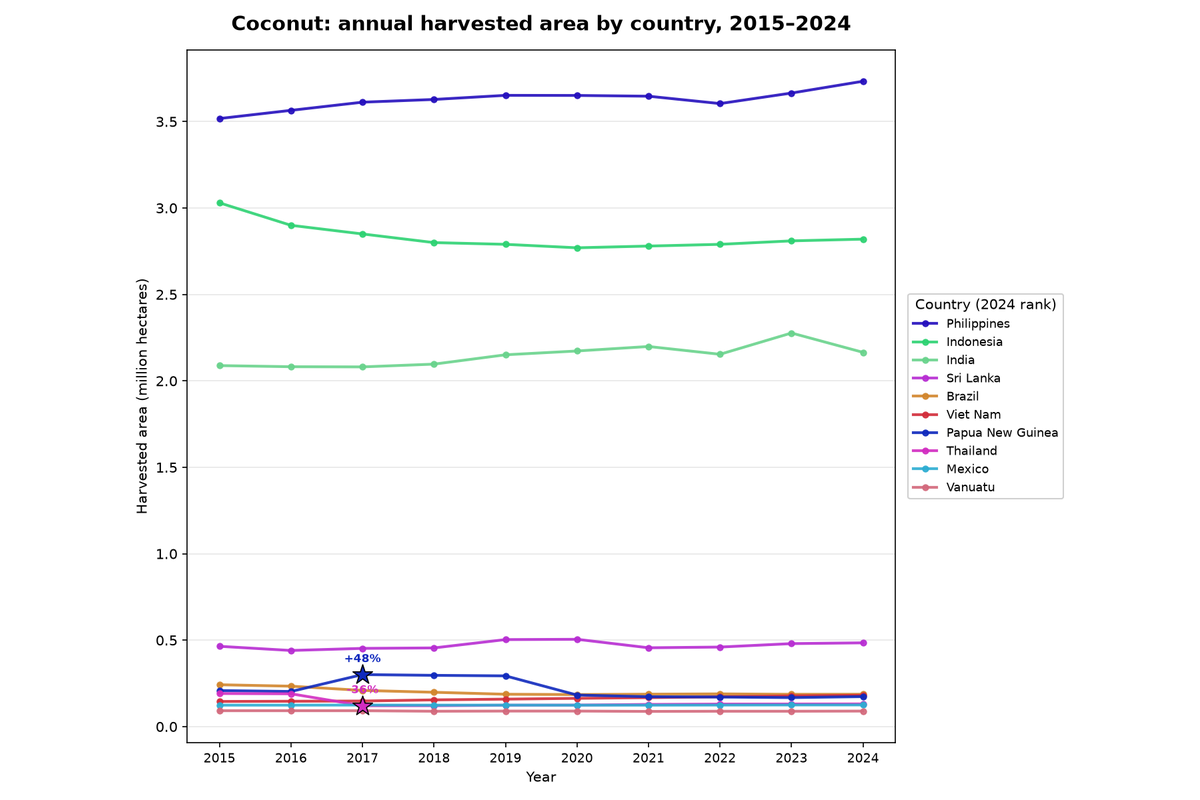
| Philippines | 3.52 | 3.73 | +6.1% | ▲ Increase |
| Indonesia | 3.03 | 2.82 | -6.9% | ▼ Decrease |
| India | 2.09 | 2.17 | +3.7% | ▲ Increase |
| Sri Lanka | 0.47 | 0.48 | +4.3% | ▲ Increase |
| Brazil | 0.24 | 0.19 | -22.7% | ▼ Decrease |
| Viet Nam | 0.15 | 0.18 | +24.6% | ▲ Increase |
| Papua New Guinea | 0.21 | 0.17 | -16.8% | ▼ Decrease |
| Thailand | 0.19 | 0.13 | -31.4% | ▼ Decrease |
| Mexico | 0.12 | 0.12 | +1.0% | ▬ Unchanged |
| Vanuatu | 0.09 | 0.09 | -2.3% | ▬ Unchanged |
| Country | 2015 (Mha) | 2024 (Mha) | Change | Trend |
|---|---|---|---|---|
| Spain | 2.35 | 2.65 | +12.5% | ▲ Increase |
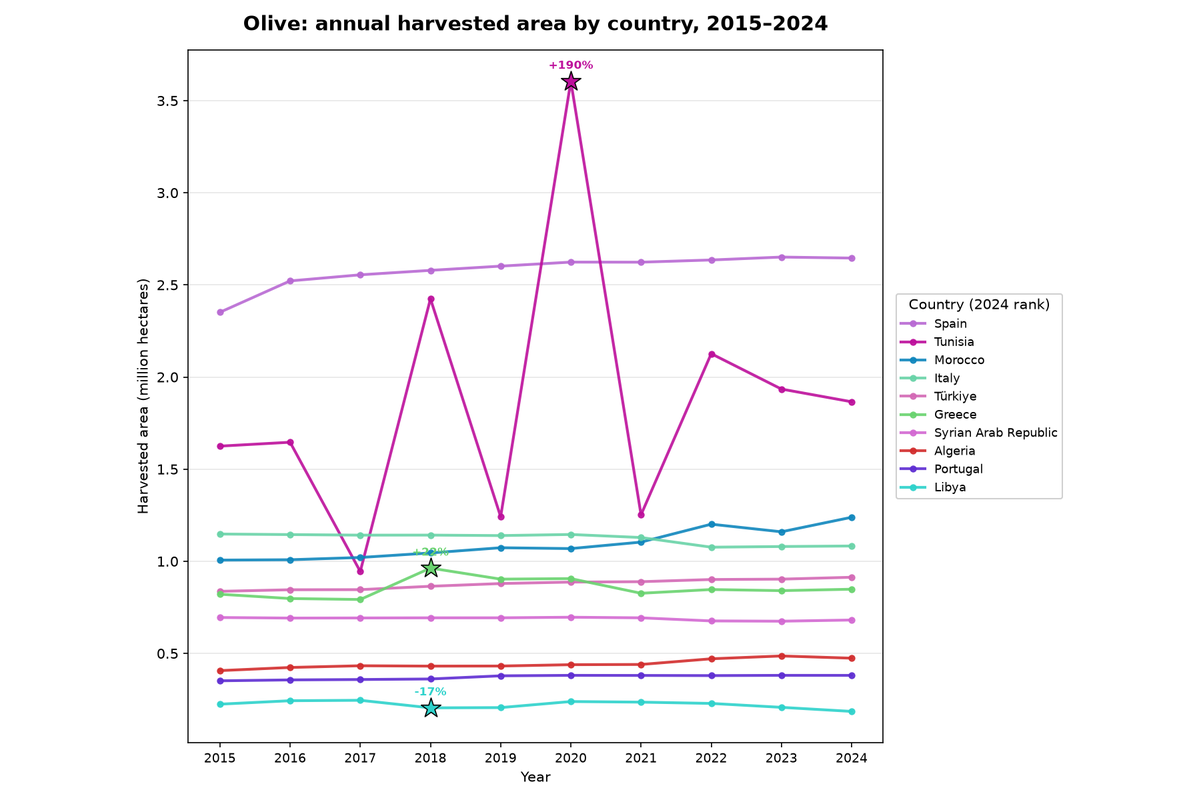
| Tunisia | 1.62 | 1.87 | +14.8% | ▲ Increase |
| Morocco | 1.01 | 1.24 | +23.1% | ▲ Increase |
| Italy | 1.15 | 1.08 | -5.7% | ▼ Decrease |
| Türkiye | 0.84 | 0.91 | +9.1% | ▲ Increase |
| Greece | 0.82 | 0.85 | +3.3% | ▲ Increase |
| Syrian Arab Republic | 0.69 | 0.68 | -2.0% | ▬ Unchanged |
| Algeria | 0.41 | 0.47 | +16.6% | ▲ Increase |
| Portugal | 0.35 | 0.38 | +8.4% | ▲ Increase |
| Libya | 0.23 | 0.18 | -17.5% | ▼ Decrease |
| Country | 2015 (Mha) | 2024 (Mha) | Change | Trend |
|---|---|---|---|---|
| Côte d'Ivoire | 3.46 | 3.81 | +10.3% | ▲ Increase |
| Indonesia | 1.71 | 1.39 | -18.9% | ▼ Decrease |
| Nigeria | 1.06 | 1.30 | +23.0% | ▲ Increase |
| Ghana | 1.68 | 0.92 | -45.4% | ▼ Decrease |
| Cameroon | 0.77 | 0.64 | -16.3% | ▼ Decrease |
| Brazil | 0.70 | 0.62 | -12.2% | ▼ Decrease |
| Sierra Leone | 0.03 | 0.20 | +560.8% | ▲ Increase |
| Colombia | 0.14 | 0.20 | +44.6% | ▲ Increase |
| Peru | 0.12 | 0.19 | +57.5% | ▲ Increase |
| Liberia | 0.04 | 0.18 | +307.3% | ▲ Increase |
| Country | 2015 (Mha) | 2024 (Mha) | Change | Trend |
|---|---|---|---|---|
| Côte d'Ivoire | 1.68 | 1.43 | -14.7% | ▼ Decrease |
| United Republic of Tanzania | 0.48 | 1.33 | +174.2% | ▲ Increase |
| India | 1.03 | 1.20 | +16.4% | ▲ Increase |
| Brazil | 0.59 | 0.45 | -23.8% | ▼ Decrease |
| Indonesia | 0.52 | 0.44 | -16.0% | ▼ Decrease |
| Ghana | 0.09 | 0.41 | +380.5% | ▲ Increase |
| Viet Nam | 0.28 | 0.28 | +1.2% | ▬ Unchanged |
| Nigeria | 0.13 | 0.17 | +29.4% | ▲ Increase |
| Mozambique | 0.10 | 0.17 | +70.0% | ▲ Increase |
| Guinea-Bissau | 0.21 | 0.16 | -25.2% | ▼ Decrease |
| Country | 2015 (Mha) | 2024 (Mha) | Change | Trend |
|---|---|---|---|---|
| India | 2.41 | 2.76 | +14.5% | ▲ Increase |
| China, mainland | 0.31 | 0.40 | +29.8% | ▲ Increase |
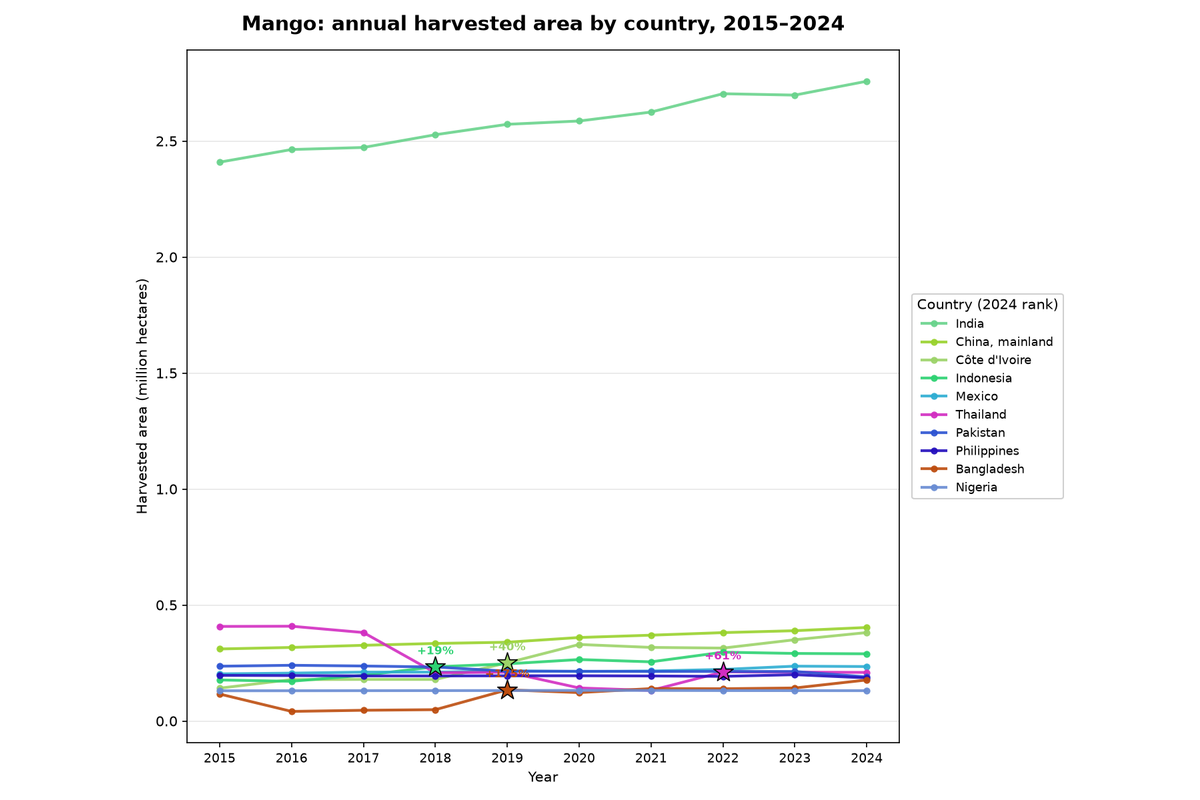
| Côte d'Ivoire | 0.14 | 0.38 | +169.3% | ▲ Increase |
| Indonesia | 0.18 | 0.29 | +63.8% | ▲ Increase |
| Mexico | 0.20 | 0.23 | +15.5% | ▲ Increase |
| Thailand | 0.41 | 0.21 | -48.6% | ▼ Decrease |
| Pakistan | 0.24 | 0.19 | -19.5% | ▼ Decrease |
| Philippines | 0.20 | 0.19 | -5.4% | ▼ Decrease |
| Bangladesh | 0.12 | 0.18 | +52.1% | ▲ Increase |
| Nigeria | 0.13 | 0.13 | +0.3% | ▬ Unchanged |
| Country | 2015 (Mha) | 2024 (Mha) | Change | Trend |
|---|---|---|---|---|
| Spain | 0.94 | 0.90 | -3.9% | ▼ Decrease |
| China, mainland | 0.80 | 0.77 | -3.5% | ▼ Decrease |
| France | 0.75 | 0.74 | -1.4% | ▬ Unchanged |
| Italy | 0.67 | 0.72 | +6.4% | ▲ Increase |
| United States of America | 0.41 | 0.37 | -9.8% | ▼ Decrease |
| Türkiye | 0.46 | 0.37 | -19.4% | ▼ Decrease |
| Argentina | 0.23 | 0.20 | -11.0% | ▼ Decrease |
| India | 0.12 | 0.18 | +49.7% | ▲ Increase |
| Portugal | 0.18 | 0.17 | -3.2% | ▼ Decrease |
| Chile | 0.20 | 0.17 | -16.4% | ▼ Decrease |
| Country | 2015 (Mha) | 2024 (Mha) | Change | Trend |
|---|---|---|---|---|
| India | 0.82 | 0.95 | +15.4% | ▲ Increase |
| Brazil | 0.48 | 0.47 | -1.7% | ▬ Unchanged |
| Nigeria | 0.44 | 0.47 | +5.6% | ▲ Increase |
| United Republic of Tanzania | 0.45 | 0.32 | -30.1% | ▼ Decrease |
| China, mainland | 0.41 | 0.31 | -24.2% | ▼ Decrease |
| Democratic Republic of the Congo | 0.22 | 0.22 | -2.7% | ▬ Unchanged |
| Rwanda | 0.17 | 0.20 | +19.5% | ▲ Increase |
| Angola | 0.13 | 0.19 | +50.1% | ▲ Increase |
| Philippines | 0.18 | 0.19 | +1.8% | ▬ Unchanged |
| Peru | 0.17 | 0.18 | +4.7% | ▲ Increase |
Ten Years, Country by Country: Where the Spikes Are
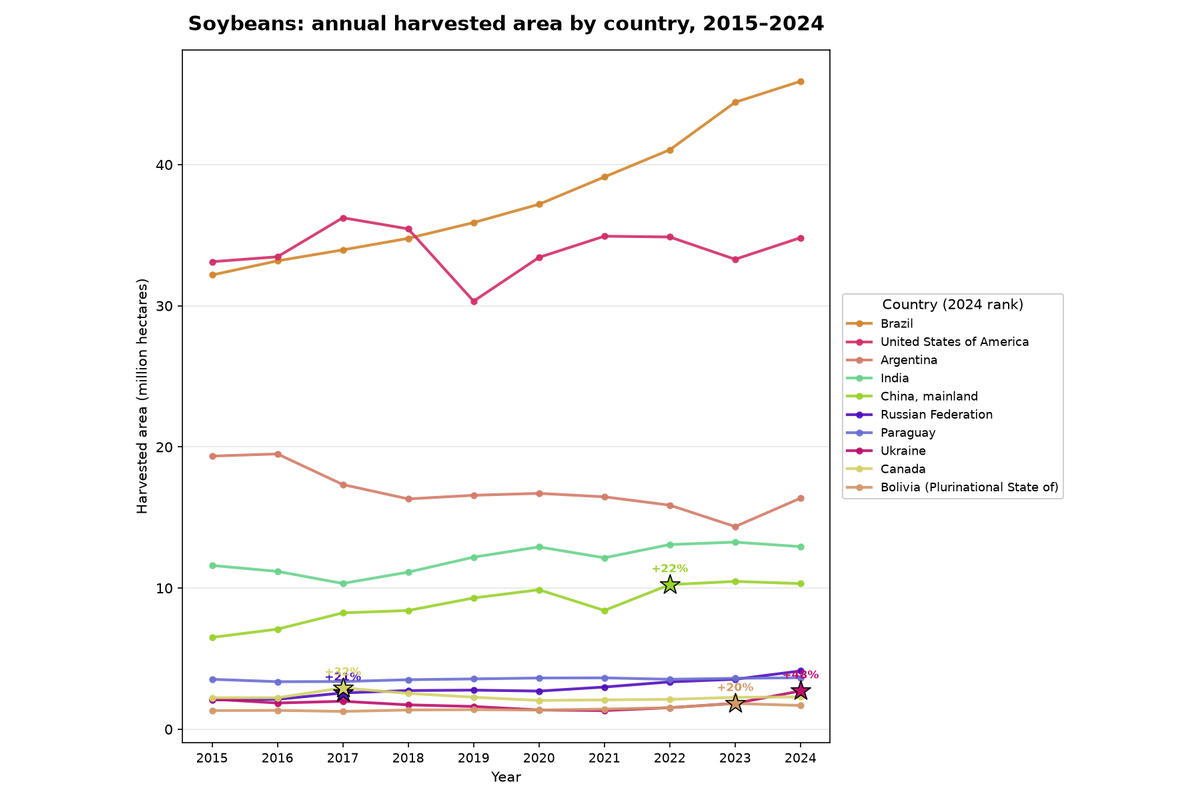
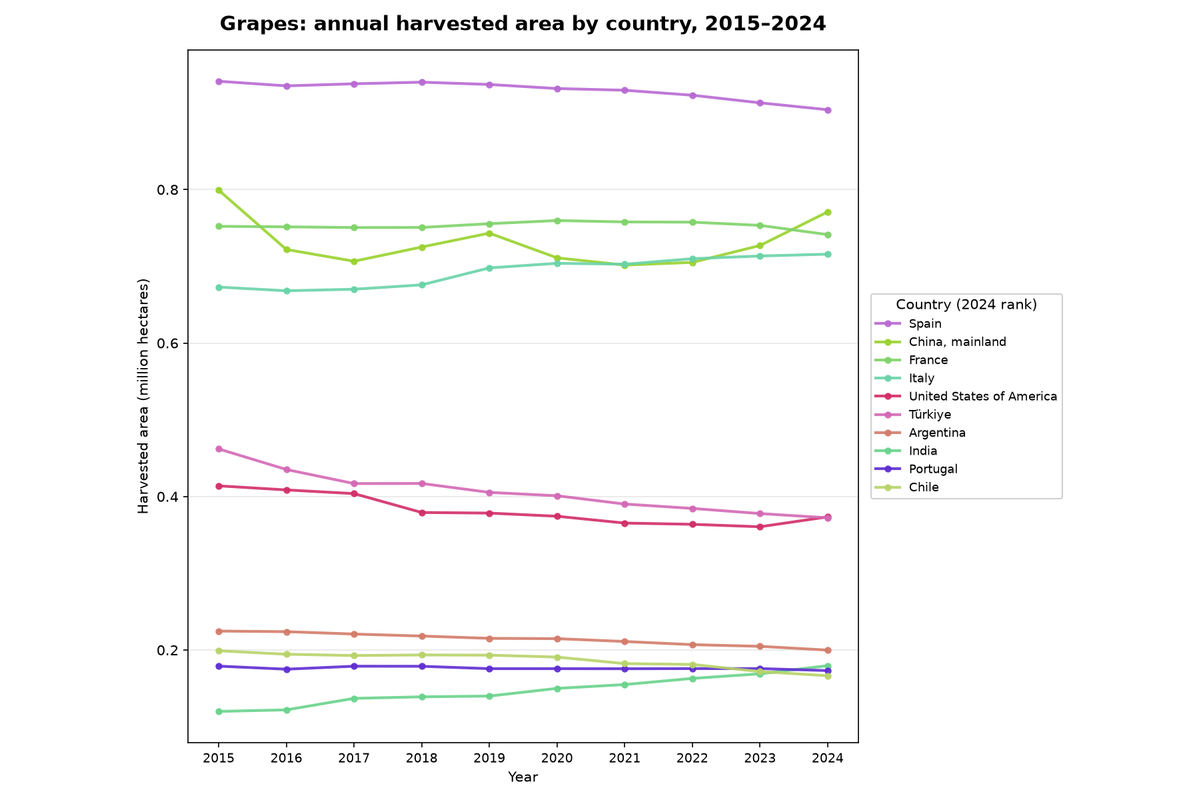
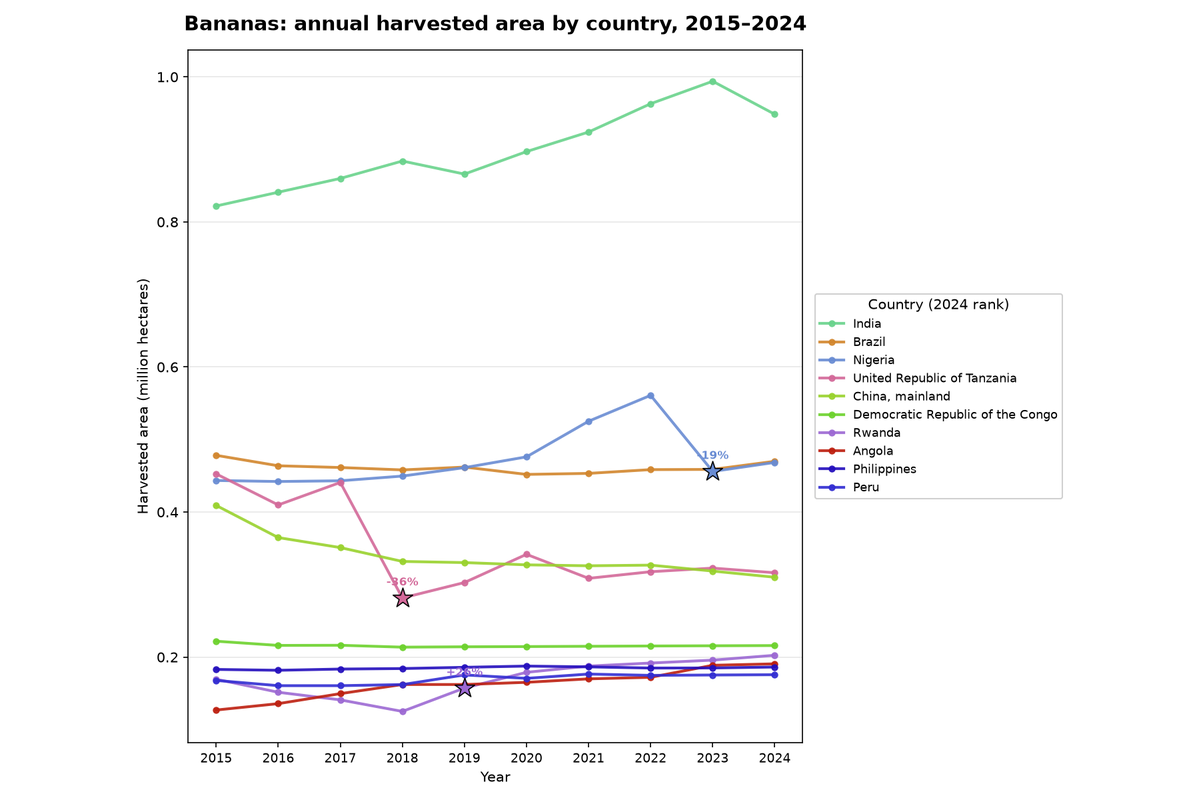
The decade tables above compare two snapshots, 2015 and 2024, which is useful for a headline number but hides everything that happened in between: a country can arrive at a flat ten-year change after a sharp expansion followed by an equally sharp pullback. The charts below plot the full annual series for the same top-10 countries, one line per crop tab, so those in-between moves are visible rather than averaged away. Each country keeps the same color across every chart in this widget, so a producer like China’s mainland or Brazil is easy to track as you switch between crops. Where a country’s area jumped or dropped by more than 15 percent from one year to the next, that point is marked with a star, a quick way to spot policy shifts, drought years, disease outbreaks, or reporting revisions worth investigating further.
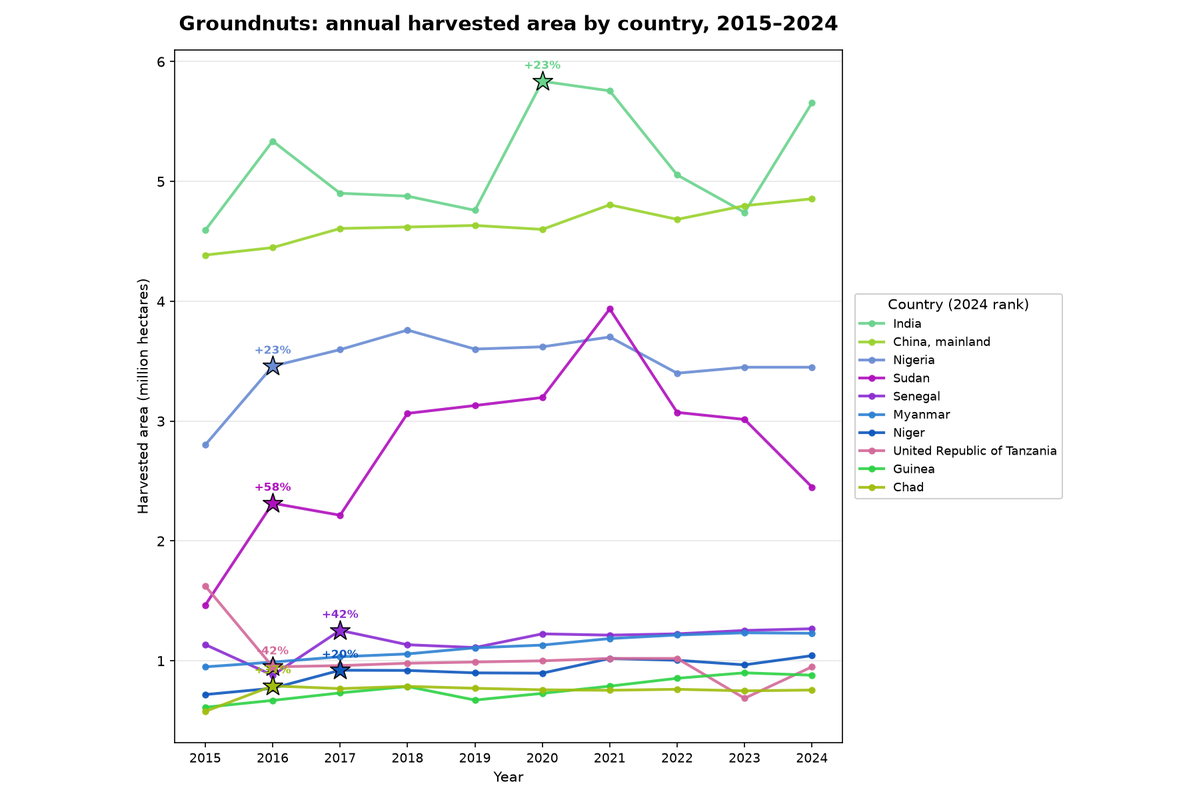
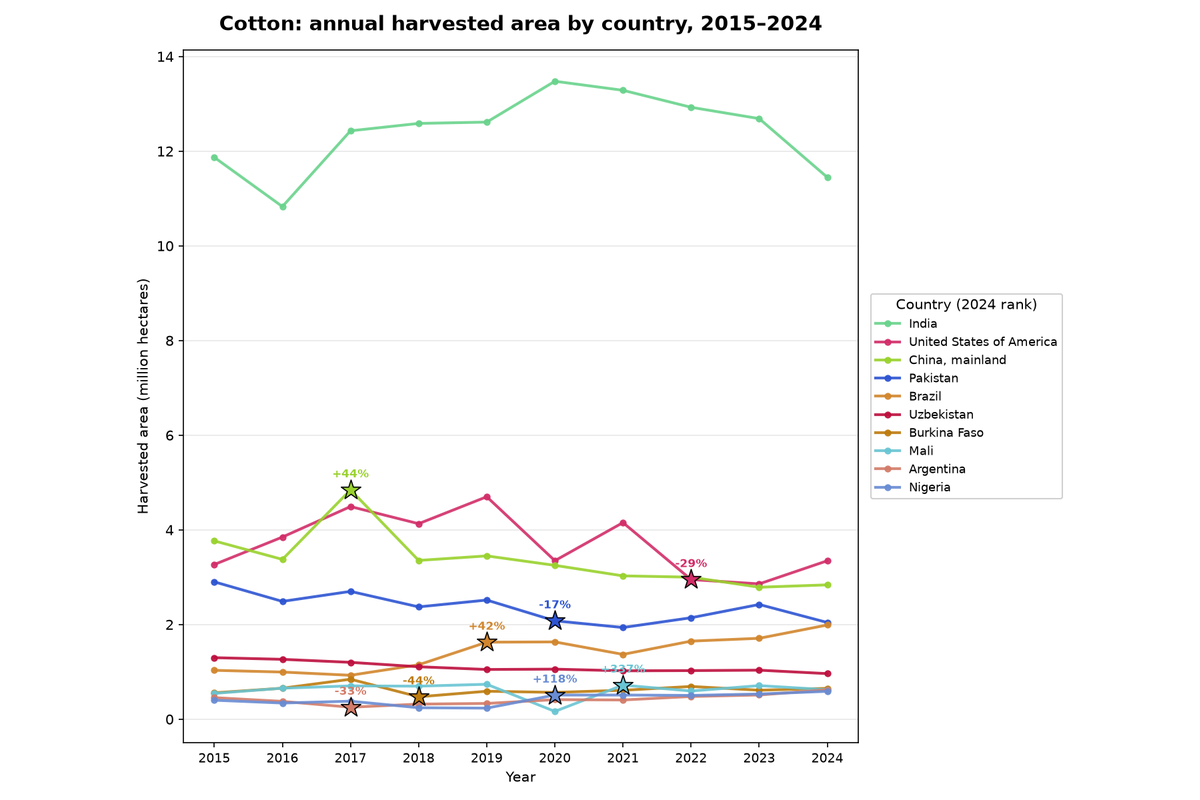
Tree and perennial crops show the same kind of in-between detail: Côte d’Ivoire’s rubber and coffee expansions, for instance, did not arrive as one smooth ten-year climb, and the annual view below makes clear roughly which years drove each move.
What This Means for Business
A single, well-sourced statistical baseline changes how procurement, sustainability, and risk teams operate. Knowing that wheat, maize, and rice together occupy the majority of the world’s field-crop land tells a grain trader where global supply shocks are most likely to matter. Knowing that the United States posted the steepest wheat-area retreat of any major producer over the past decade (-18.3%, versus milder pullbacks in Türkiye and China), that Argentina’s maize area has nearly doubled, that Côte d’Ivoire’s rubber footprint has more than quadrupled, and that Ghana’s cocoa area has shrunk by nearly half, tells a buyer exactly which origin countries are shifting fastest and where sourcing and compliance risk is concentrating first.
This kind of ranking is also a planning tool. A buyer sourcing an annual crop can, in principle, diversify origin countries relatively quickly if a region underperforms. A buyer sourcing a tree crop is locked into whatever land-use decisions were made years or decades earlier, which makes early monitoring of expansion and contraction trends considerably more valuable.
None of this replaces on-the-ground verification, but it does tell you where to look first. National-level FAOSTAT statistics establish which countries and commodities matter most in aggregate; they are the map, not the terrain. Once the map is drawn, the next step is to zoom in: to specific regions, specific fields, and specific growing seasons, using freely available satellite data to verify what official statistics can only summarize. That is exactly where this series goes next, applying the same rigor demonstrated here to individual commodities and the regions that grow them.
This post used public FAOSTAT statistics as a baseline. If you need to verify harvested area, monitor land-use change, or track a specific growing region with satellite data, we can scope a custom analysis for your supply chain.