The previous blog post moved from global crop statistics to mapped concentrations of soybean, oil palm and olive. This article takes the next commercial step: moving from a broad soybean concentration to individual fields for closer review.
We analyze an area in Mato Grosso, Brazil. It connects three business questions:
- is a visible forest-clearing signal associated with a delineated agricultural field;
- what crop is the field most likely to support; and
- does its seasonal vegetation activity indicate crop-production potential?
This matters because soya is covered by the European Union Deforestation Regulation. If cultivation and commercial sourcing are independently confirmed, eventual production associated with this field—or with neighboring fields—could potentially enter supply chains serving EU markets. The present analysis does not establish that any harvest was produced, sold, transported or imported into the EU.
1. From visible clearing to a field-level signal
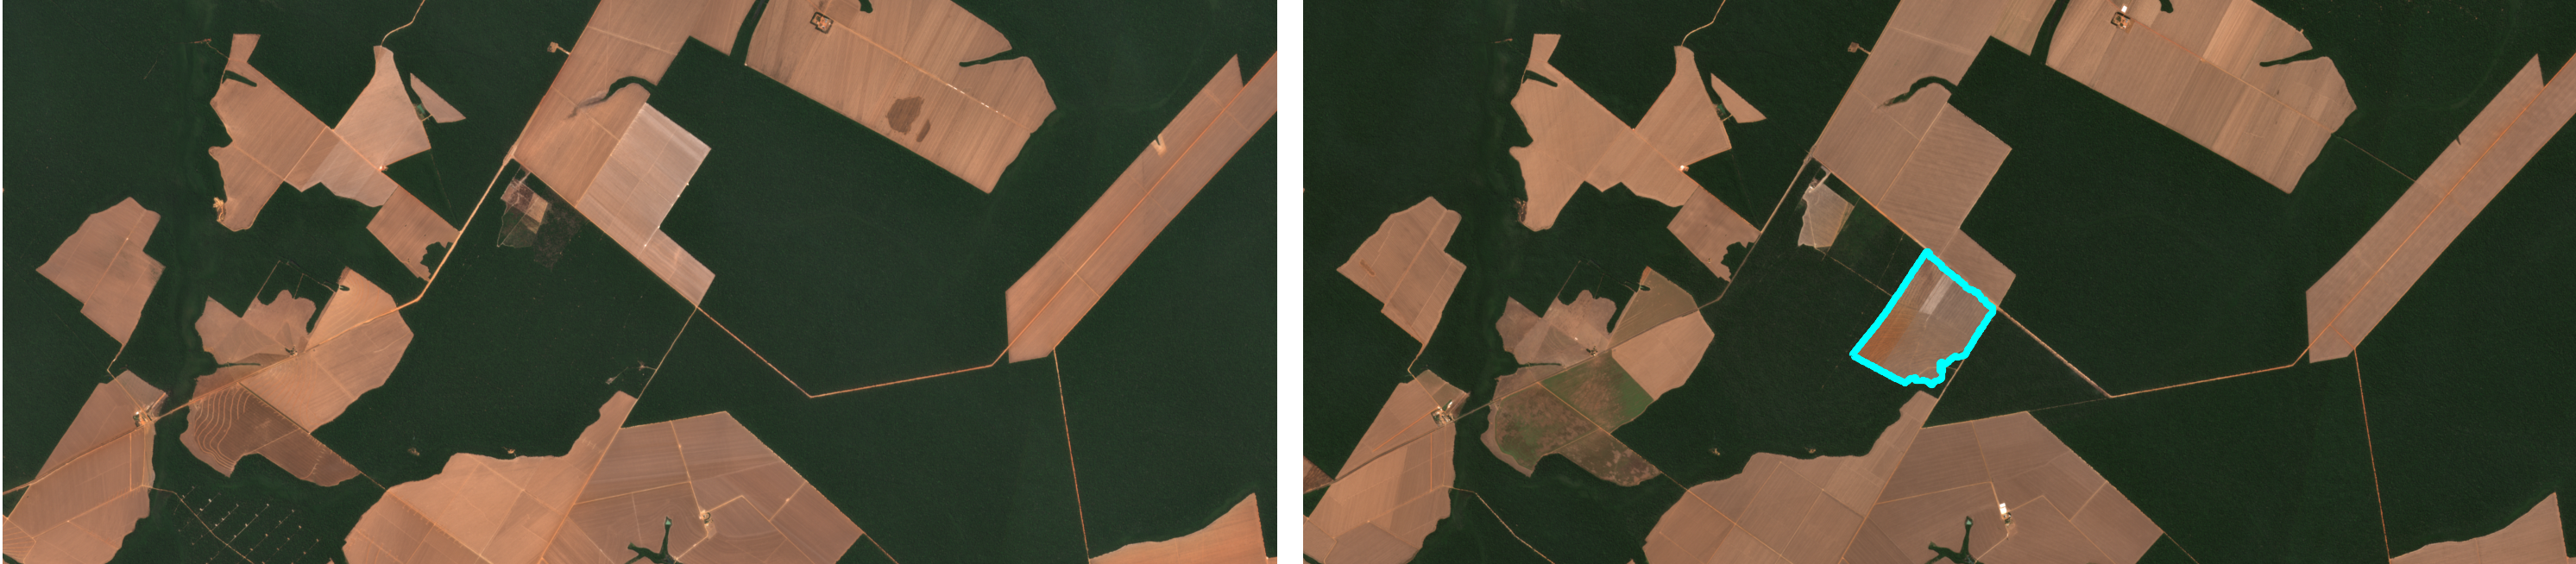
Natural-colour satellite images from 14 August 2022 and 31 July 2026 show a material change inside an area that previously appeared forested in the 2022 satellite image. The image-derived clearing component covers approximately 349.04 hectares.
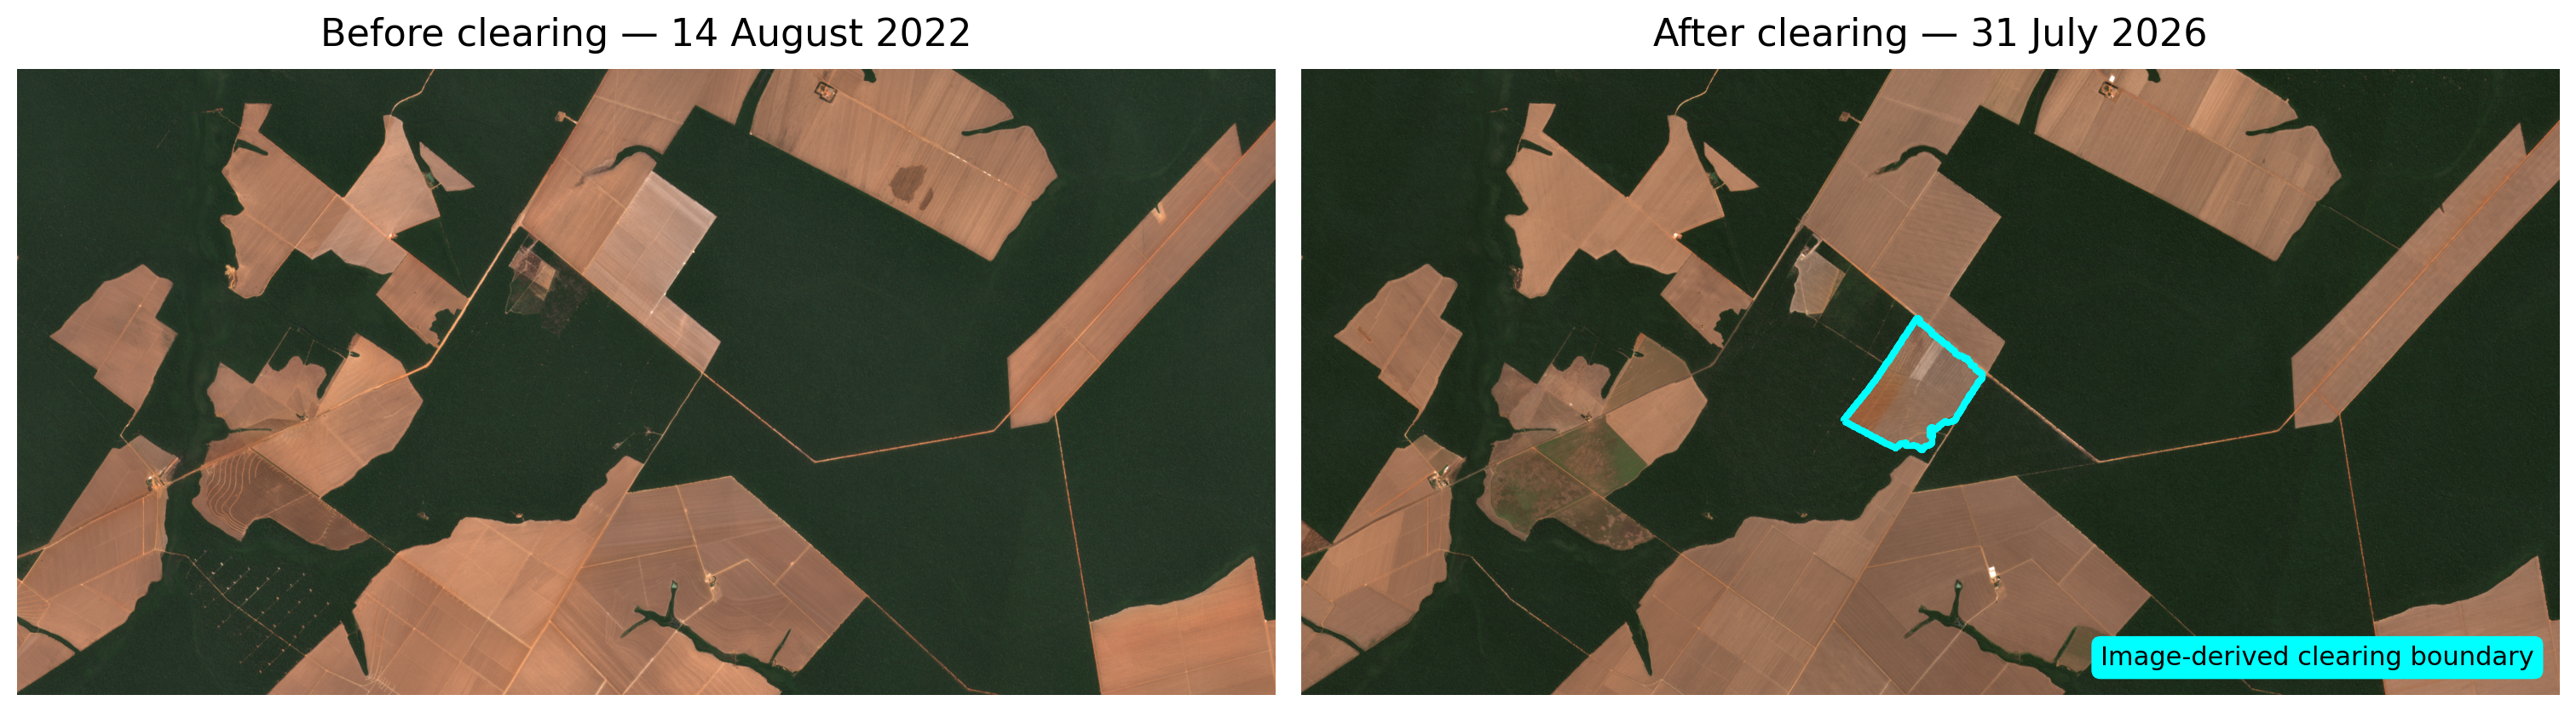
Satellite appearance alone cannot determine ownership, authorization, legality or the final use of the land. Its role is to identify where more detailed field-level checks should begin.
2. Converting the clearing into agricultural field boundaries
Using field delineation we converted the 2026 image into 80 candidate field segments. Applying the agricultural screening rule retained 77 fields. The clearing field covers approximately 334.30 hectares and overlaps approximately 328.38 hectares of the image-derived clearing component.
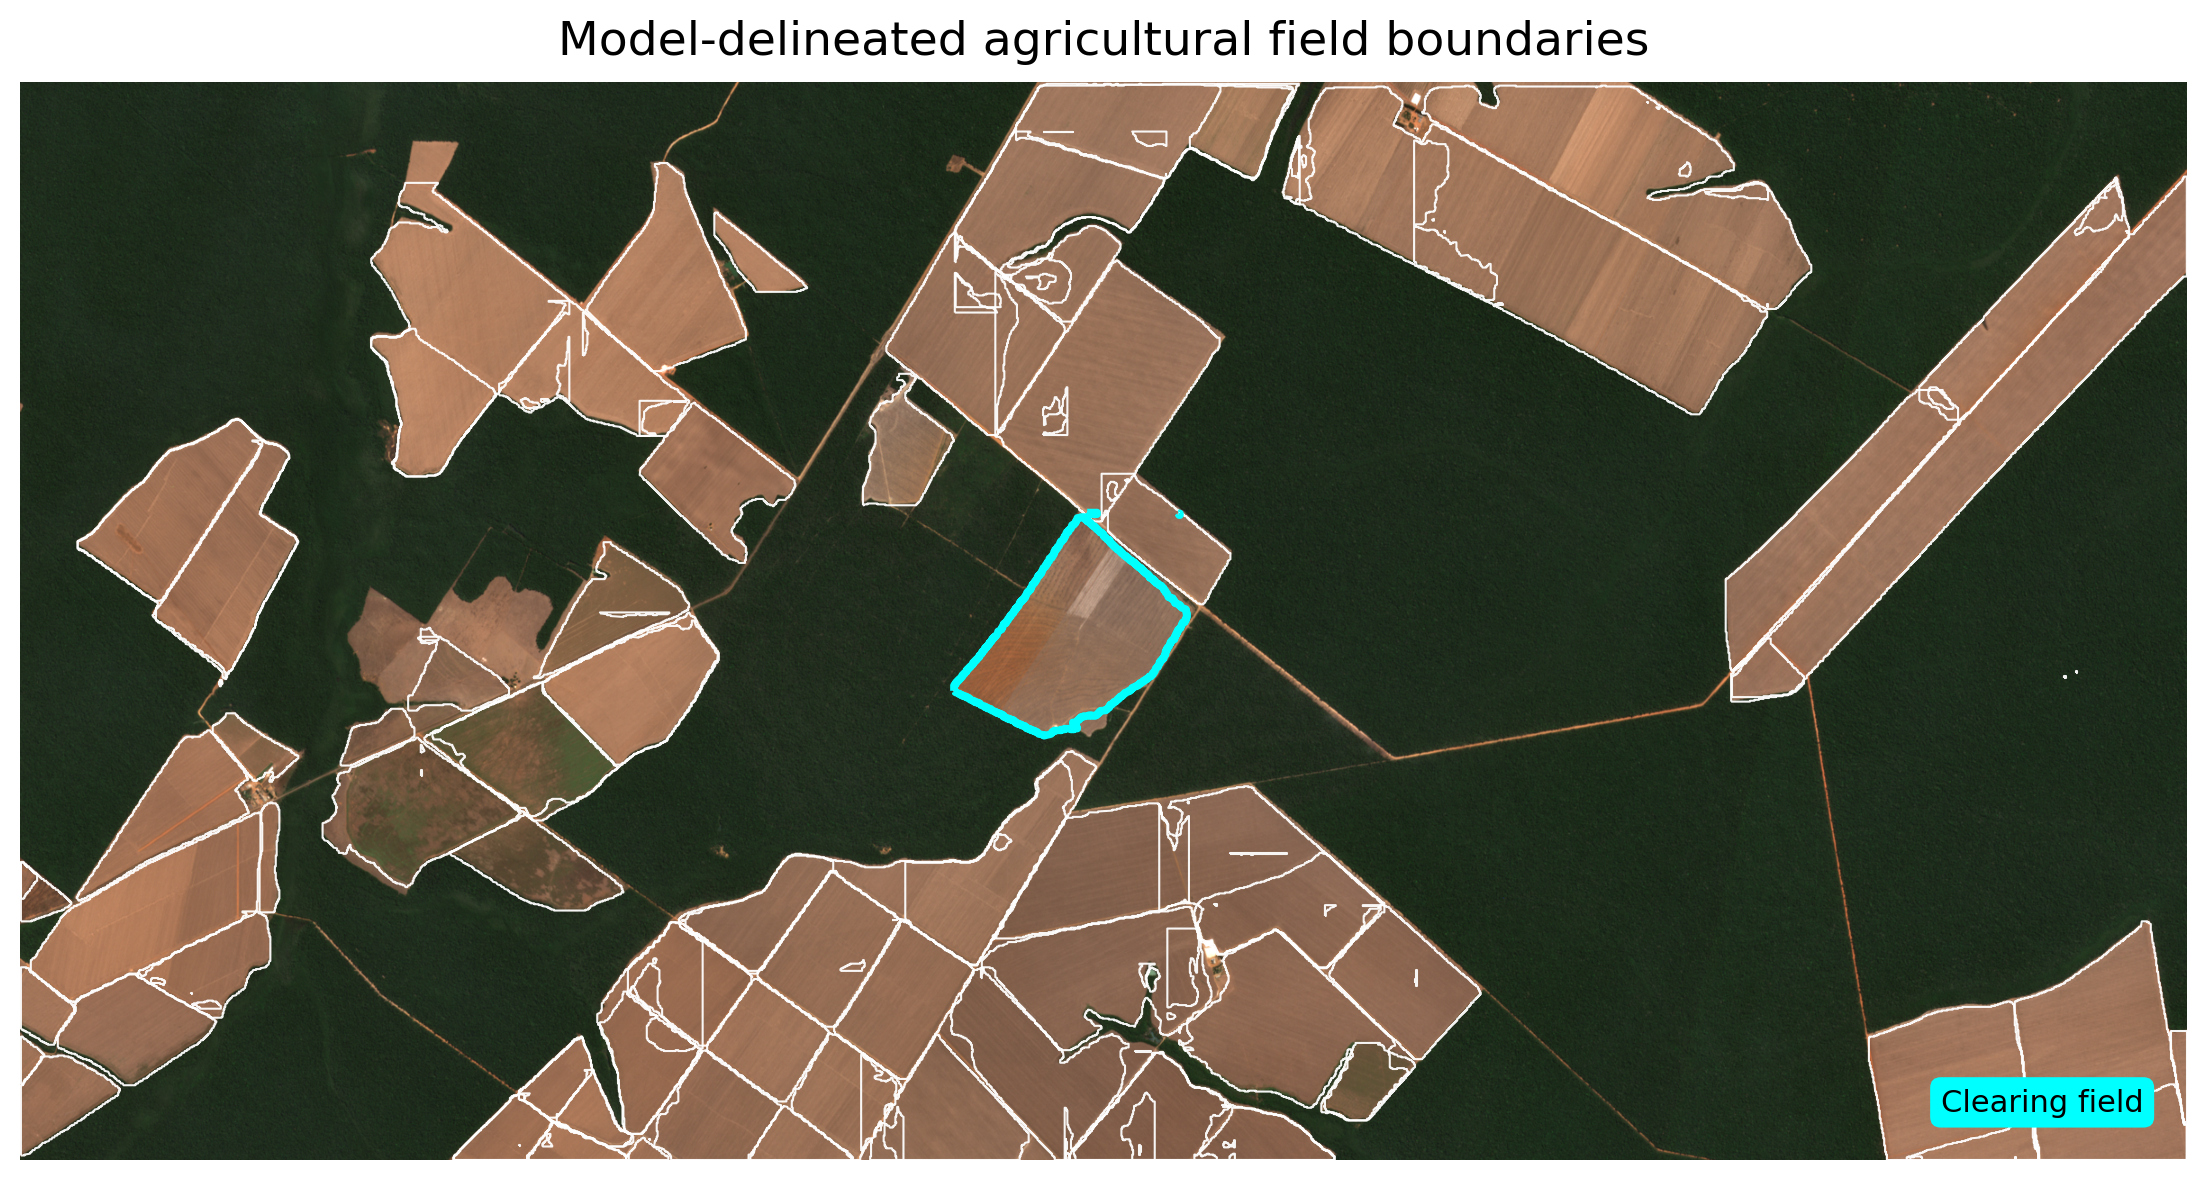
Crop prediction and seasonal vegetation monitoring can now be summarized for the same field instead of for a broad regional grid or an arbitrary image window.
3. Predicting the crop type
We took advantage of the World Cereal research project and proceeded with the October 2025 to April 2026 seasonal window. For the clearing field, 53.6% of pixels met the cropland classification rule. Within those pixels, the leading crop prediction was soybeans at 88.1% mean model probability. The next prediction was fibre crops at 7.1%.
The WorldCereal result is a model prediction and not the ground-truth crop data.
Across the wider screening area, 75 of 77 agricultural fields were predicted as soybean. Their unique mapped footprint is approximately 10,129.77 hectares. The model-delineated soybean segment areas sum to 12,845.69 hectares before overlaps are dissolved, so the unique footprint is used for regional area reporting. This provides regional context, but every boundary and crop label remains model-derived.
4. Assessing seasonal crop-production potential
The Fraction of Absorbed Photosynthetically Active Radiation measures how much incoming light vegetation absorbs for photosynthesis. In this workflow it is used as a field-level vegetation-activity indicator.
The relationship between the three analytical components is direct:
| Component | Commercial role |
|---|---|
| Field delineation | Defines the field that will be assessed consistently |
| WorldCereal | Predicts the most likely crop type within cropland-classified pixels |
| Fraction of Absorbed Photosynthetically Active Radiation | Tracks seasonal canopy activity inside the same field |
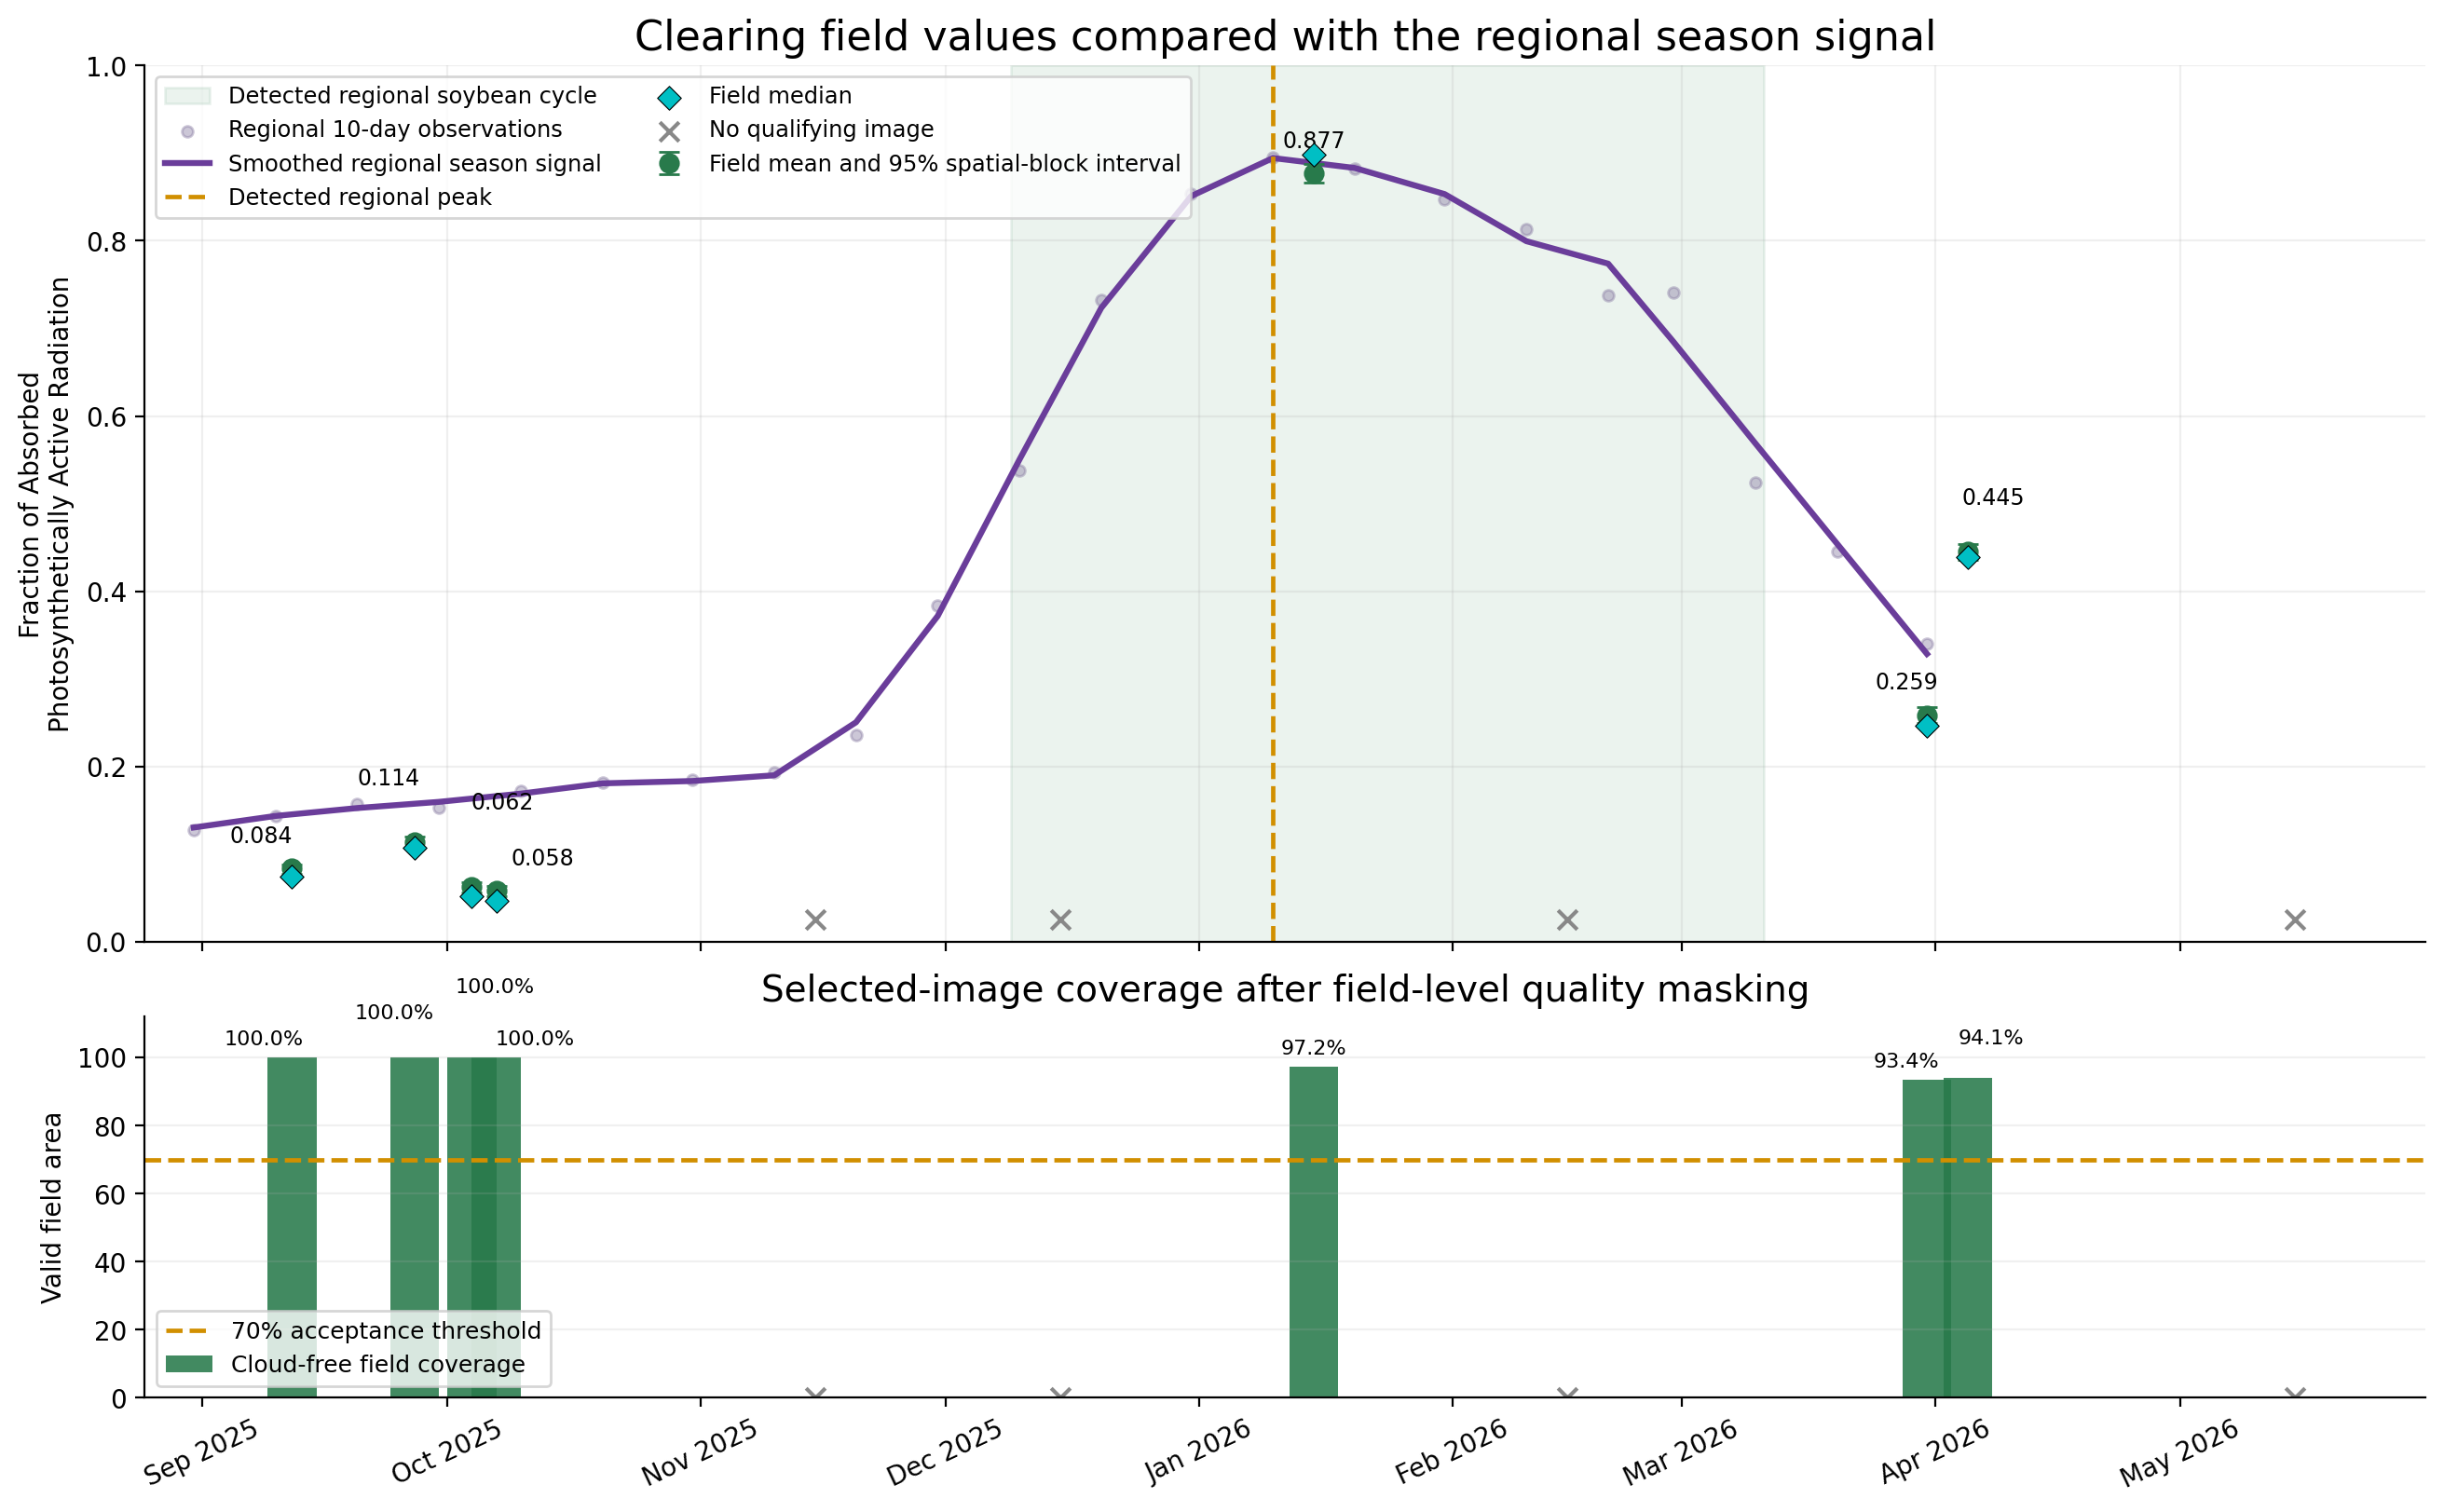
The timing was first established from a cleaned series of 441 unique 10-day regional observations. For the soybean candidate, the detected cycle starts around 9 December 2025, peaks around 10 January 2026 and ends around 11 March 2026. The signal-quality assessment was good and also indicated more than one crop cycle in the regional time series.
For field-level monitoring, Sentinel-2 acquisitions from September 2025 through May 2026 were filtered to less than 30% tile cloud cover. Each candidate was cropped to the clearing field, cloud and shadow pixels were removed, and the images were ranked by valid coverage inside the field. Up to two images per month were retained only when at least 70% of the field remained valid.
This retained seven images: two in September, two in October and one each in January, March and April. November, December and February had no catalogue image below the 30% tile-cloud threshold. The May candidate did not reach 70% valid field coverage.
| Month | Selected images | Field mean | Field median | Valid field coverage |
|---|---|---|---|---|
| September 2025 | 2 | 0.099 | 0.090 | 100.0% |
| October 2025 | 2 | 0.060 | 0.049 | 100.0% |
| November 2025 | 0 | — | — | No qualifying image |
| December 2025 | 0 | — | — | No qualifying image |
| January 2026 | 1 | 0.877 | 0.898 | 97.2% |
| February 2026 | 0 | — | — | No qualifying image |
| March 2026 | 1 | 0.259 | 0.247 | 93.4% |
| April 2026 | 1 | 0.445 | 0.439 | 94.1% |
| May 2026 | 0 | — | — | Below 70% field coverage |
The mean and median remain close for every available month. Tests based on non-overlapping 200-metre spatial blocks found clear differences between the available monthly field distributions after multiple-comparison correction. These tests assess spatial separation inside the field; they do not create independent temporal replication where only one qualifying image was available.
January provides the only qualifying field image inside the detected regional soybean cycle. Its high canopy activity aligns with the regional peak. The lower March value and partial April increase occur later and may reflect canopy decline, harvest, regrowth or a subsequent crop cycle; the available images cannot distinguish these outcomes independently.
This combination supports a restrained crop-production-potential interpretation: a delineated field, a strong soybean prediction and temporally aligned vegetation activity occur in the same spatial unit.
5. Confidence for the clearing field
The clearing field remains the reference example because it directly connects the visible change boundary with the crop and vegetation results.
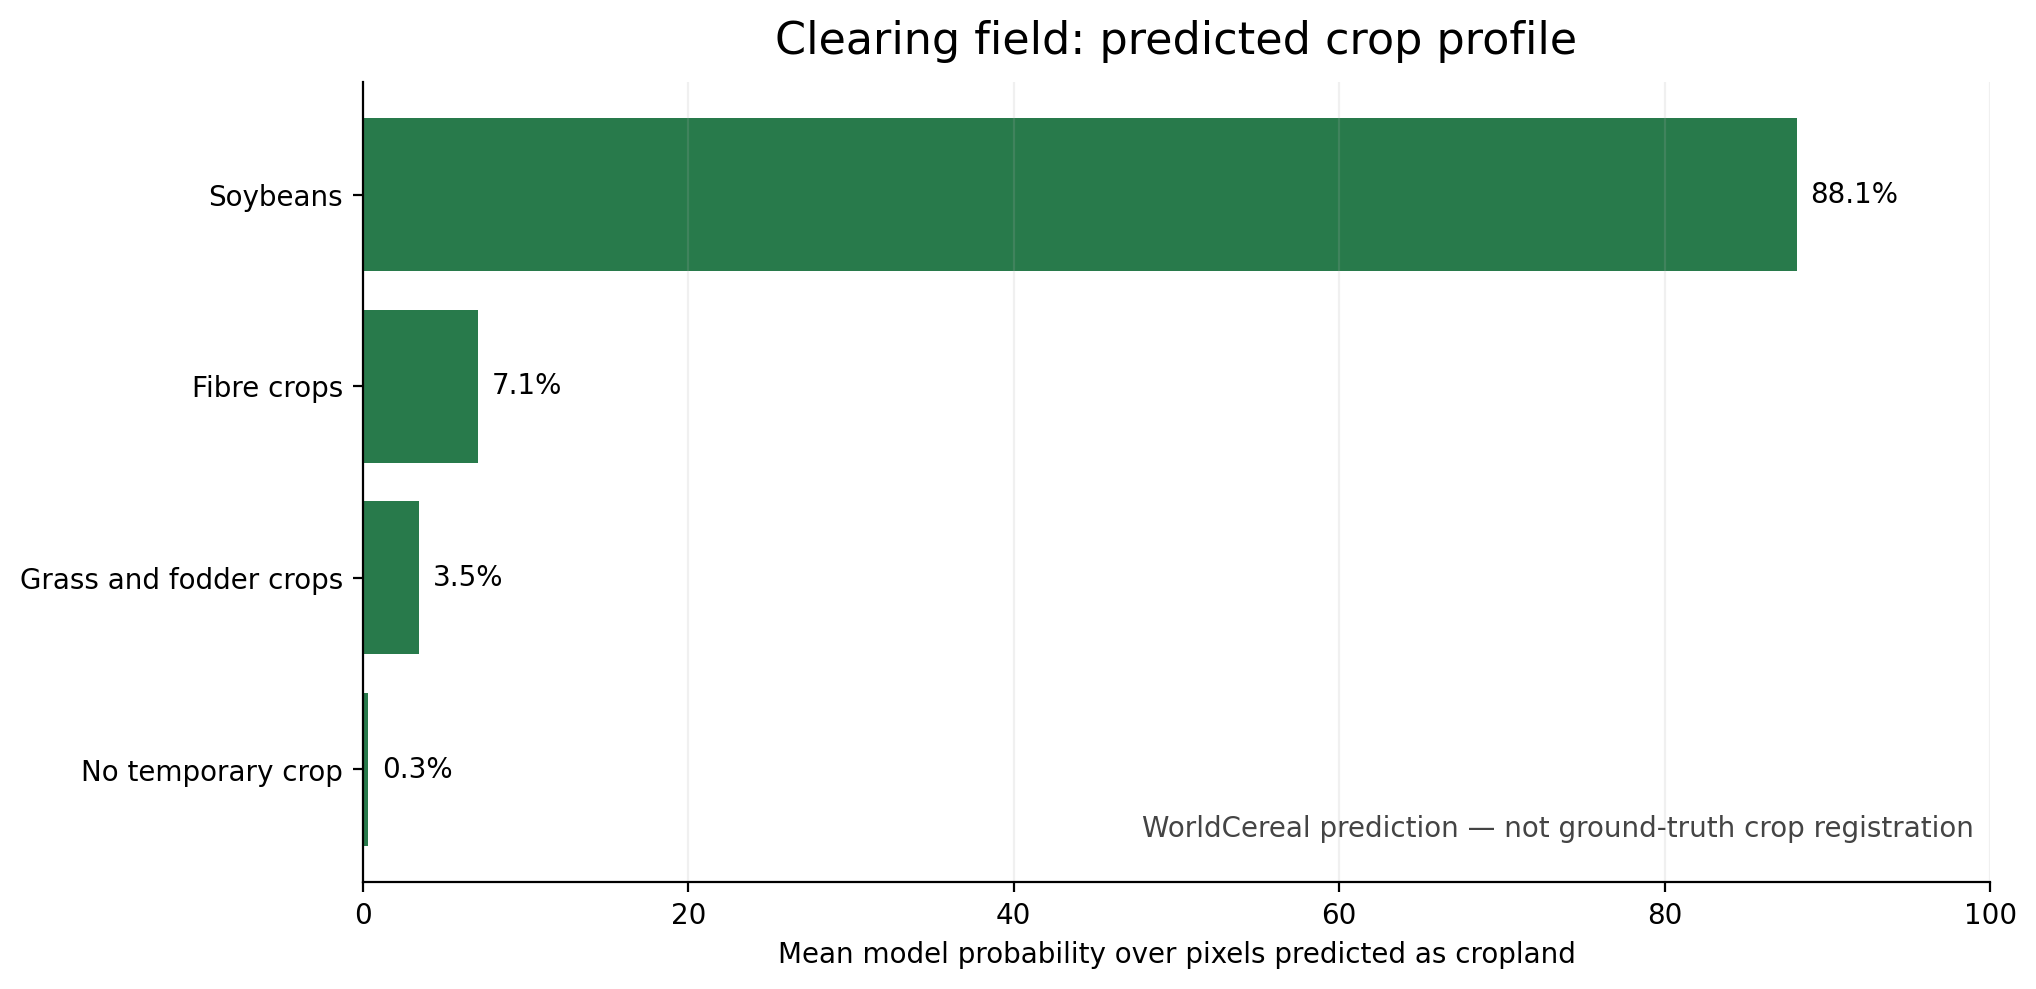
| Clearing-field result | Value |
|---|---|
| Display ID | 3 |
| Mapped area | 334.30 ha |
| Share of field classified as cropland | 53.6% |
| Predicted crop | Soybeans |
| Mean soybean model probability | 88.1% |
| Detected regional crop cycle | 9 December 2025–11 March 2026 |
| Qualifying field images, September–May | 7 |
| Qualifying images inside detected regional cycle | 1 |
| January field mean / median | 0.877 / 0.898 |
| March field mean / median | 0.259 / 0.247 |
| Minimum valid coverage among selected images | 93.4% |
The cropland share is close to the 50% inclusion threshold. This makes the field commercially relevant for follow-up, but also means that its agricultural classification should be corroborated before a transaction-level decision.
6. Extending the screen to neighboring fields
The field-delineation and crop-prediction process was applied to every agricultural field in the surrounding area. This creates a consistent screening portfolio for prioritizing supplier checks, parcel documentation and higher-resolution review.
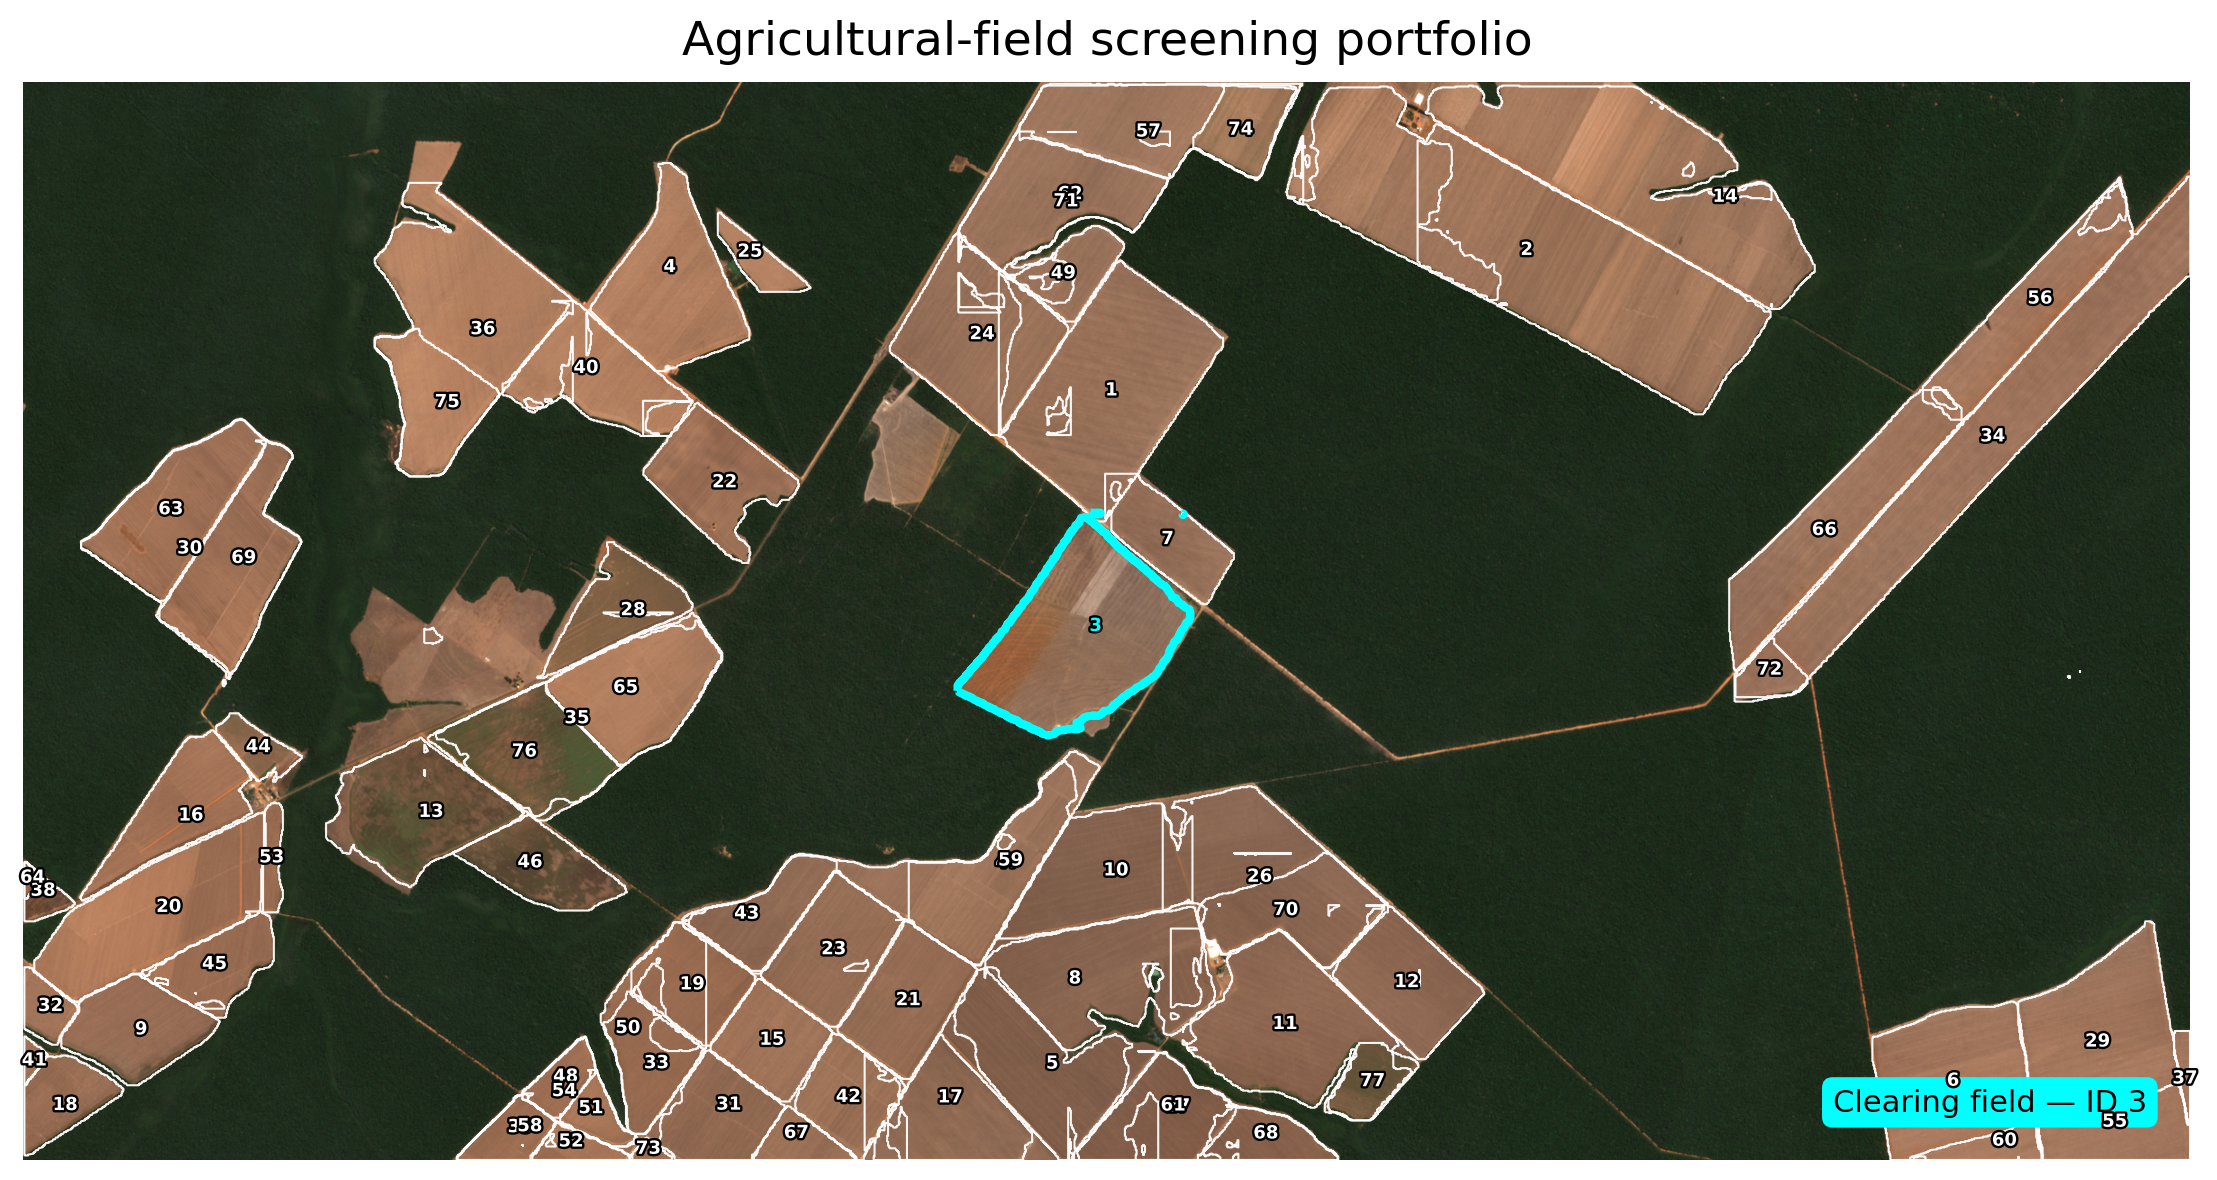
| Predicted crop | Fields | Unique mapped footprint | Mean crop-model probability |
|---|---|---|---|
| Soybeans | 75 | 10,129.77 ha | 88.9% |
| Fibre crops | 2 | 21.02 ha | 50.9% |
View the complete 77-field screening table
| Field ID | Predicted crop | Area (ha) | Mean crop-model probability |
|---|---|---|---|
| 1 | Soybeans | 384.89 | 88.3% |
| 2 | Soybeans | 766.38 | 94.1% |
| 3 | Soybeans | 334.30 | 88.1% |
| 4 | Soybeans | 211.85 | 89.7% |
| 5 | Soybeans | 214.57 | 92.5% |
| 6 | Soybeans | 269.07 | 90.5% |
| 7 | Soybeans | 102.78 | 75.8% |
| 8 | Soybeans | 249.95 | 90.3% |
| 9 | Soybeans | 127.78 | 93.3% |
| 10 | Soybeans | 208.36 | 89.2% |
| 11 | Soybeans | 321.39 | 90.1% |
| 12 | Soybeans | 149.34 | 91.2% |
| 13 | Soybeans | 200.76 | 92.1% |
| 14 | Soybeans | 535.31 | 85.0% |
| 15 | Soybeans | 101.51 | 74.0% |
| 16 | Soybeans | 136.61 | 88.7% |
| 17 | Soybeans | 166.29 | 74.7% |
| 18 | Soybeans | 71.37 | 80.1% |
| 19 | Soybeans | 106.43 | 96.0% |
| 20 | Soybeans | 262.16 | 90.6% |
| 21 | Soybeans | 142.30 | 86.6% |
| 22 | Soybeans | 147.51 | 86.7% |
| 23 | Soybeans | 143.69 | 90.0% |
| 24 | Soybeans | 243.72 | 90.9% |
| 25 | Soybeans | 35.07 | 89.2% |
| 26 | Soybeans | 303.46 | 84.3% |
| 27 | Soybeans | 183.89 | 84.2% |
| 28 | Soybeans | 103.98 | 93.4% |
| 29 | Soybeans | 358.28 | 91.0% |
| 30 | Soybeans | 372.09 | 92.2% |
| 31 | Soybeans | 108.09 | 85.5% |
| 32 | Soybeans | 31.66 | 94.0% |
| 33 | Soybeans | 92.27 | 91.3% |
| 34 | Soybeans | 486.27 | 86.9% |
| 35 | Soybeans | 338.46 | 93.8% |
| 36 | Soybeans | 391.33 | 90.2% |
| 37 | Soybeans | 12.04 | 83.8% |
| 38 | Fibre crops | 21.02 | 46.9% |
| 39 | Soybeans | 44.74 | 95.6% |
| 40 | Soybeans | 160.15 | 88.5% |
| 41 | Soybeans | 7.53 | 87.1% |
| 42 | Soybeans | 104.50 | 78.4% |
| 43 | Soybeans | 95.65 | 81.1% |
| 44 | Soybeans | 34.55 | 78.8% |
| 45 | Soybeans | 89.29 | 90.0% |
| 46 | Soybeans | 106.51 | 85.8% |
| 47 | Soybeans | 167.30 | 81.6% |
| 48 | Soybeans | 37.37 | 95.4% |
| 49 | Soybeans | 67.03 | 93.0% |
| 50 | Soybeans | 151.23 | 93.7% |
| 51 | Soybeans | 33.80 | 95.0% |
| 52 | Soybeans | 26.14 | 95.6% |
| 53 | Soybeans | 22.88 | 91.2% |
| 54 | Soybeans | 70.66 | 95.3% |
| 55 | Soybeans | 104.36 | 93.0% |
| 56 | Soybeans | 174.13 | 86.4% |
| 57 | Soybeans | 238.95 | 95.5% |
| 58 | Soybeans | 70.93 | 95.7% |
| 59 | Soybeans | 307.51 | 80.4% |
| 60 | Soybeans | 34.79 | 93.8% |
| 61 | Soybeans | 120.07 | 85.9% |
| 62 | Soybeans | 463.66 | 95.7% |
| 63 | Soybeans | 183.19 | 94.1% |
| 64 | Fibre crops | 4.47 | 54.9% |
| 65 | Soybeans | 184.81 | 93.8% |
| 66 | Soybeans | 229.64 | 89.6% |
| 67 | Soybeans | 37.27 | 79.2% |
| 68 | Soybeans | 57.46 | 79.3% |
| 69 | Soybeans | 183.93 | 90.7% |
| 70 | Soybeans | 145.98 | 86.7% |
| 71 | Soybeans | 207.06 | 95.9% |
| 72 | Soybeans | 36.06 | 89.2% |
| 73 | Soybeans | 6.58 | 96.8% |
| 74 | Soybeans | 76.77 | 96.8% |
| 75 | Soybeans | 123.53 | 88.4% |
| 76 | Soybeans | 171.52 | 93.2% |
| 77 | Soybeans | 52.95 | 69.9% |
The row highlighted in cyan color corresponds to the clearing field.
Detailed per-image vegetation quality control is presented for the clearing field. The wider portfolio table therefore reports crop-model probability rather than mixing that field-specific workflow with the earlier regional composites.
7. What this service can support
This type of assessment can help a commercial team:
- move from a commodity concentration to specific fields requiring review;
- detect visible land-cover change between dated satellite images;
- create consistent operational field units;
- predict likely crop types and rank their confidence;
- monitor seasonal vegetation activity; and
- prioritize document collection where commodities could potentially enter EU-serving supply chains.
It does not establish legal deforestation, land ownership, supplier identity, crop yield, harvest volume, shipment history or regulatory compliance. Those decisions require traceability records, parcel documentation, authorization data and—where risk remains—additional independent evidence.
The commercial value lies in prioritization: connecting a visible clearing, a delineated field, a soybean prediction and seasonal vegetation activity in one reviewable record. In this case, the evidence supports soybean crop-production potential in the clearing field, while leaving the actual destination of any production unresolved.
Attribution:
- Regulatory context: Current consolidated text of Regulation (EU) 2023/1115.
- Satellite imagery: Contains modified Copernicus Sentinel data 2022, 2025 and 2026. Copernicus attribution guidance.
- WorldCereal: WorldCereal classification module and Van Tricht et al..
- WorldCover 2021: © ESA WorldCover project 2021 / Contains modified Copernicus Sentinel data (2021) processed by ESA WorldCover consortium; CC BY 4.0 and dataset record.
- ERA5-Land: Contains modified Copernicus Climate Change Service information 2025–2026. Neither the European Commission nor the European Centre for Medium-Range Weather Forecasts is responsible for any use of that information. Dataset record.
- Copernicus elevation data: Produced using Copernicus WorldDEM-30 © DLR e.V. 2010–2014 and © Airbus Defence and Space GmbH 2014–2018 provided under COPERNICUS by the European Union and ESA; all rights reserved. The organisations in charge of the Copernicus programme incur no liability for its use. Licence.
- Seasonal vegetation indicator: Implementation adapted from the Sentinel Hub script, licensed under CC BY-SA 4.0.
- Field delineation: Generated by running the unmodified Delineate Anything model locally. Only derived vector boundaries are presented.
- Series connection: Previous Monopteryx article on soybean, oil palm and olive crop grids.
Monopteryx combines satellite change screening, field delineation, crop prediction and seasonal vegetation monitoring to prioritize supply-chain due diligence.