The earlier CROPGRIDS comparison explained why oil palm deserves its own spatial investigation. It combines exceptional land productivity with a documented history of expansion into forest and peatland. That relationship was especially important during the rapid growth of plantations in Indonesia and Malaysia in the 1990s and 2000s. It also changed over time: the earlier article reports that the estimated forest-conversion share of new Malaysian oil-palm plantations declined from approximately 56% in 1990–2000 to 33% in 2006–2010. These values describe the previous land cover of new plantations—not oil palm’s share of all deforestation.
This article moves from that regional evidence to a single landscape in Riau Province, Indonesia. We connect three scales of evidence: historical optical imagery and tree-cover loss, canopy structure and field boundaries, and individual palm counts translated into indicative yield estimates.
1. From a regional pattern to one plantation landscape
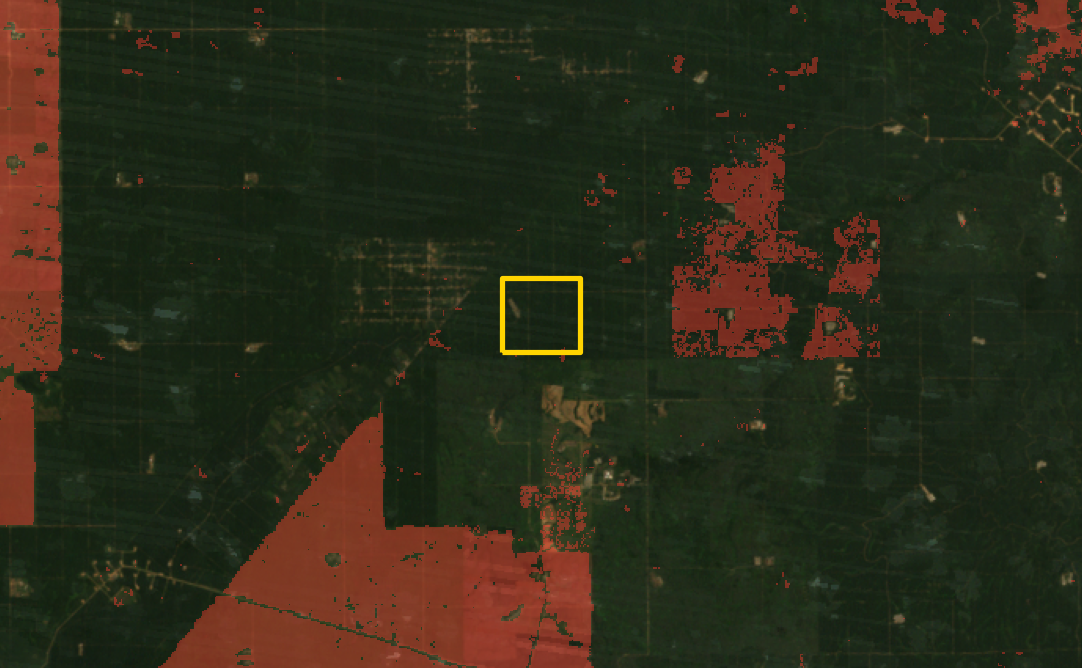
The small yellow rectangle (delineated area) below is the external boundary of a 3 × 6 grid of 18 complete plantation fields. Each frame displays a much larger landscape: a 9.6 km margin around the field area of interest. The boundary is held fixed while the Landsat record moves from 1998 to 2009, letting us view the local transition within its surrounding landscape.
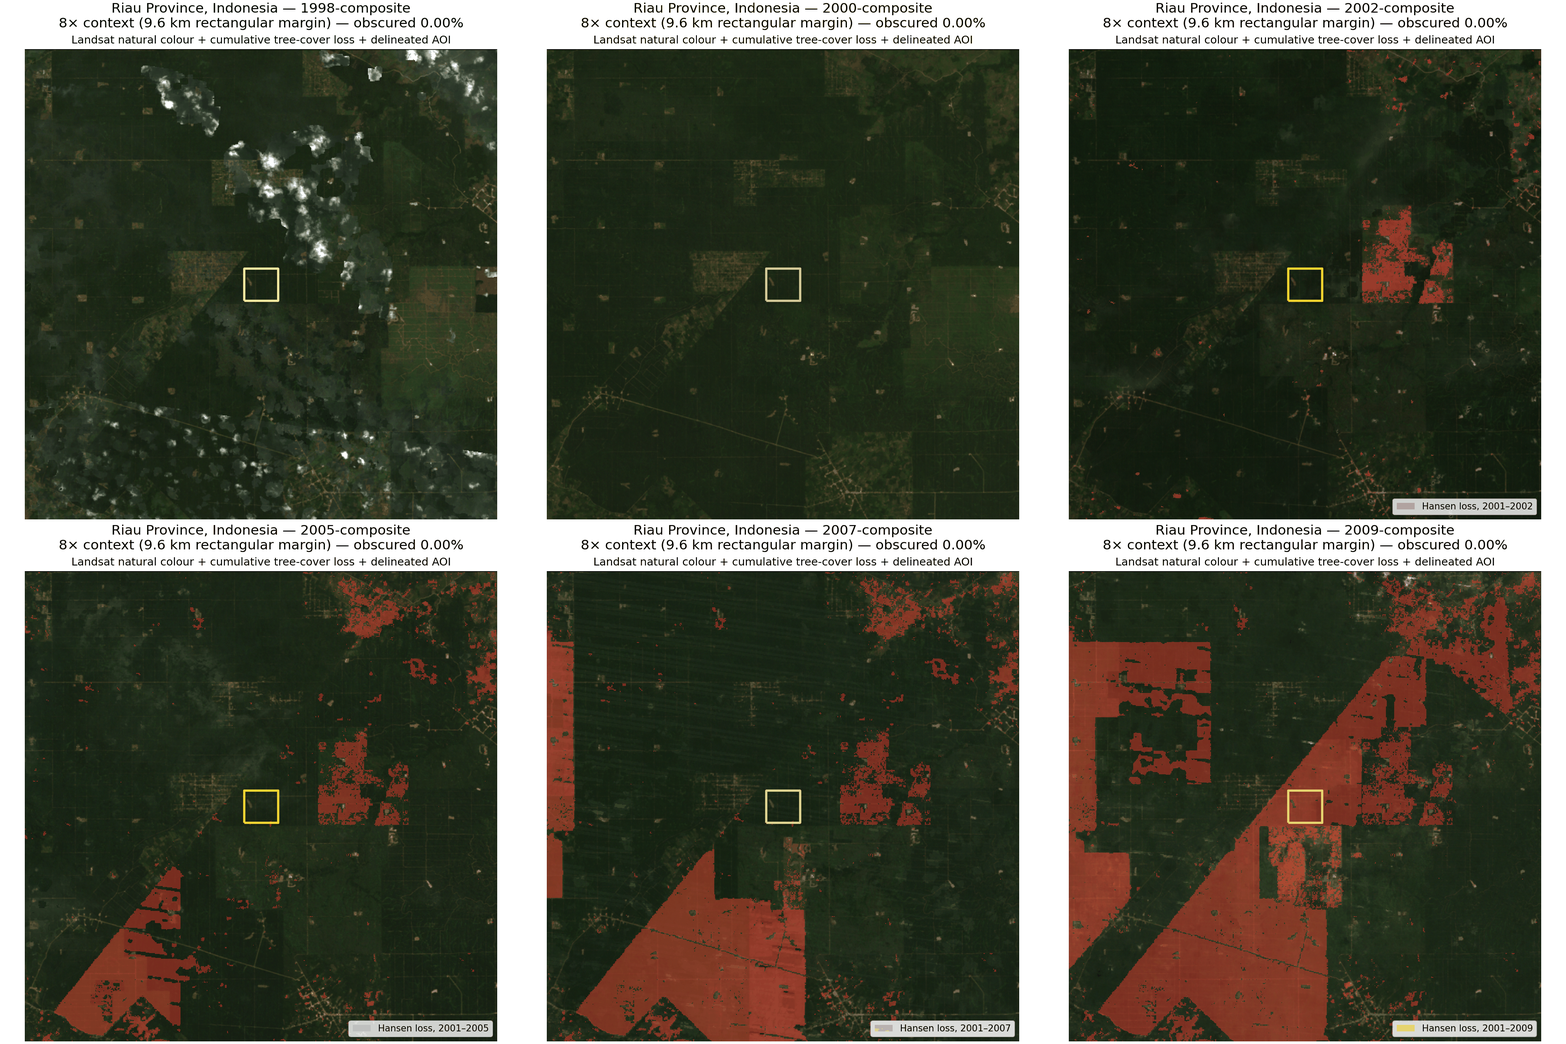
Each frame shows an annual Landsat natural-colour composite, the delineated area of interest in yellow and cumulative tree-cover loss in red. The annual tree-loss record begins in 2001, so the 1998–2000 frames intentionally contain no red overlay. In every annual composite, less than 5% of the entire displayed rectangular area is obscured by clouds, cloud shadows, snow, saturated pixels or missing data.
The sequence shows closed canopy at the start, followed by large rectangular clearings and a road grid that becomes prominent by 2008. Tree-cover loss inside the complete-field area of interest occurred mainly in 2008 (41.15%) and 2009 (52.73%), with smaller mapped fractions in 2004 and 2010. By 2009, the animation captures the majority of the mapped clearing within the area of interest.
2. From delineated fields to individual palm crowns
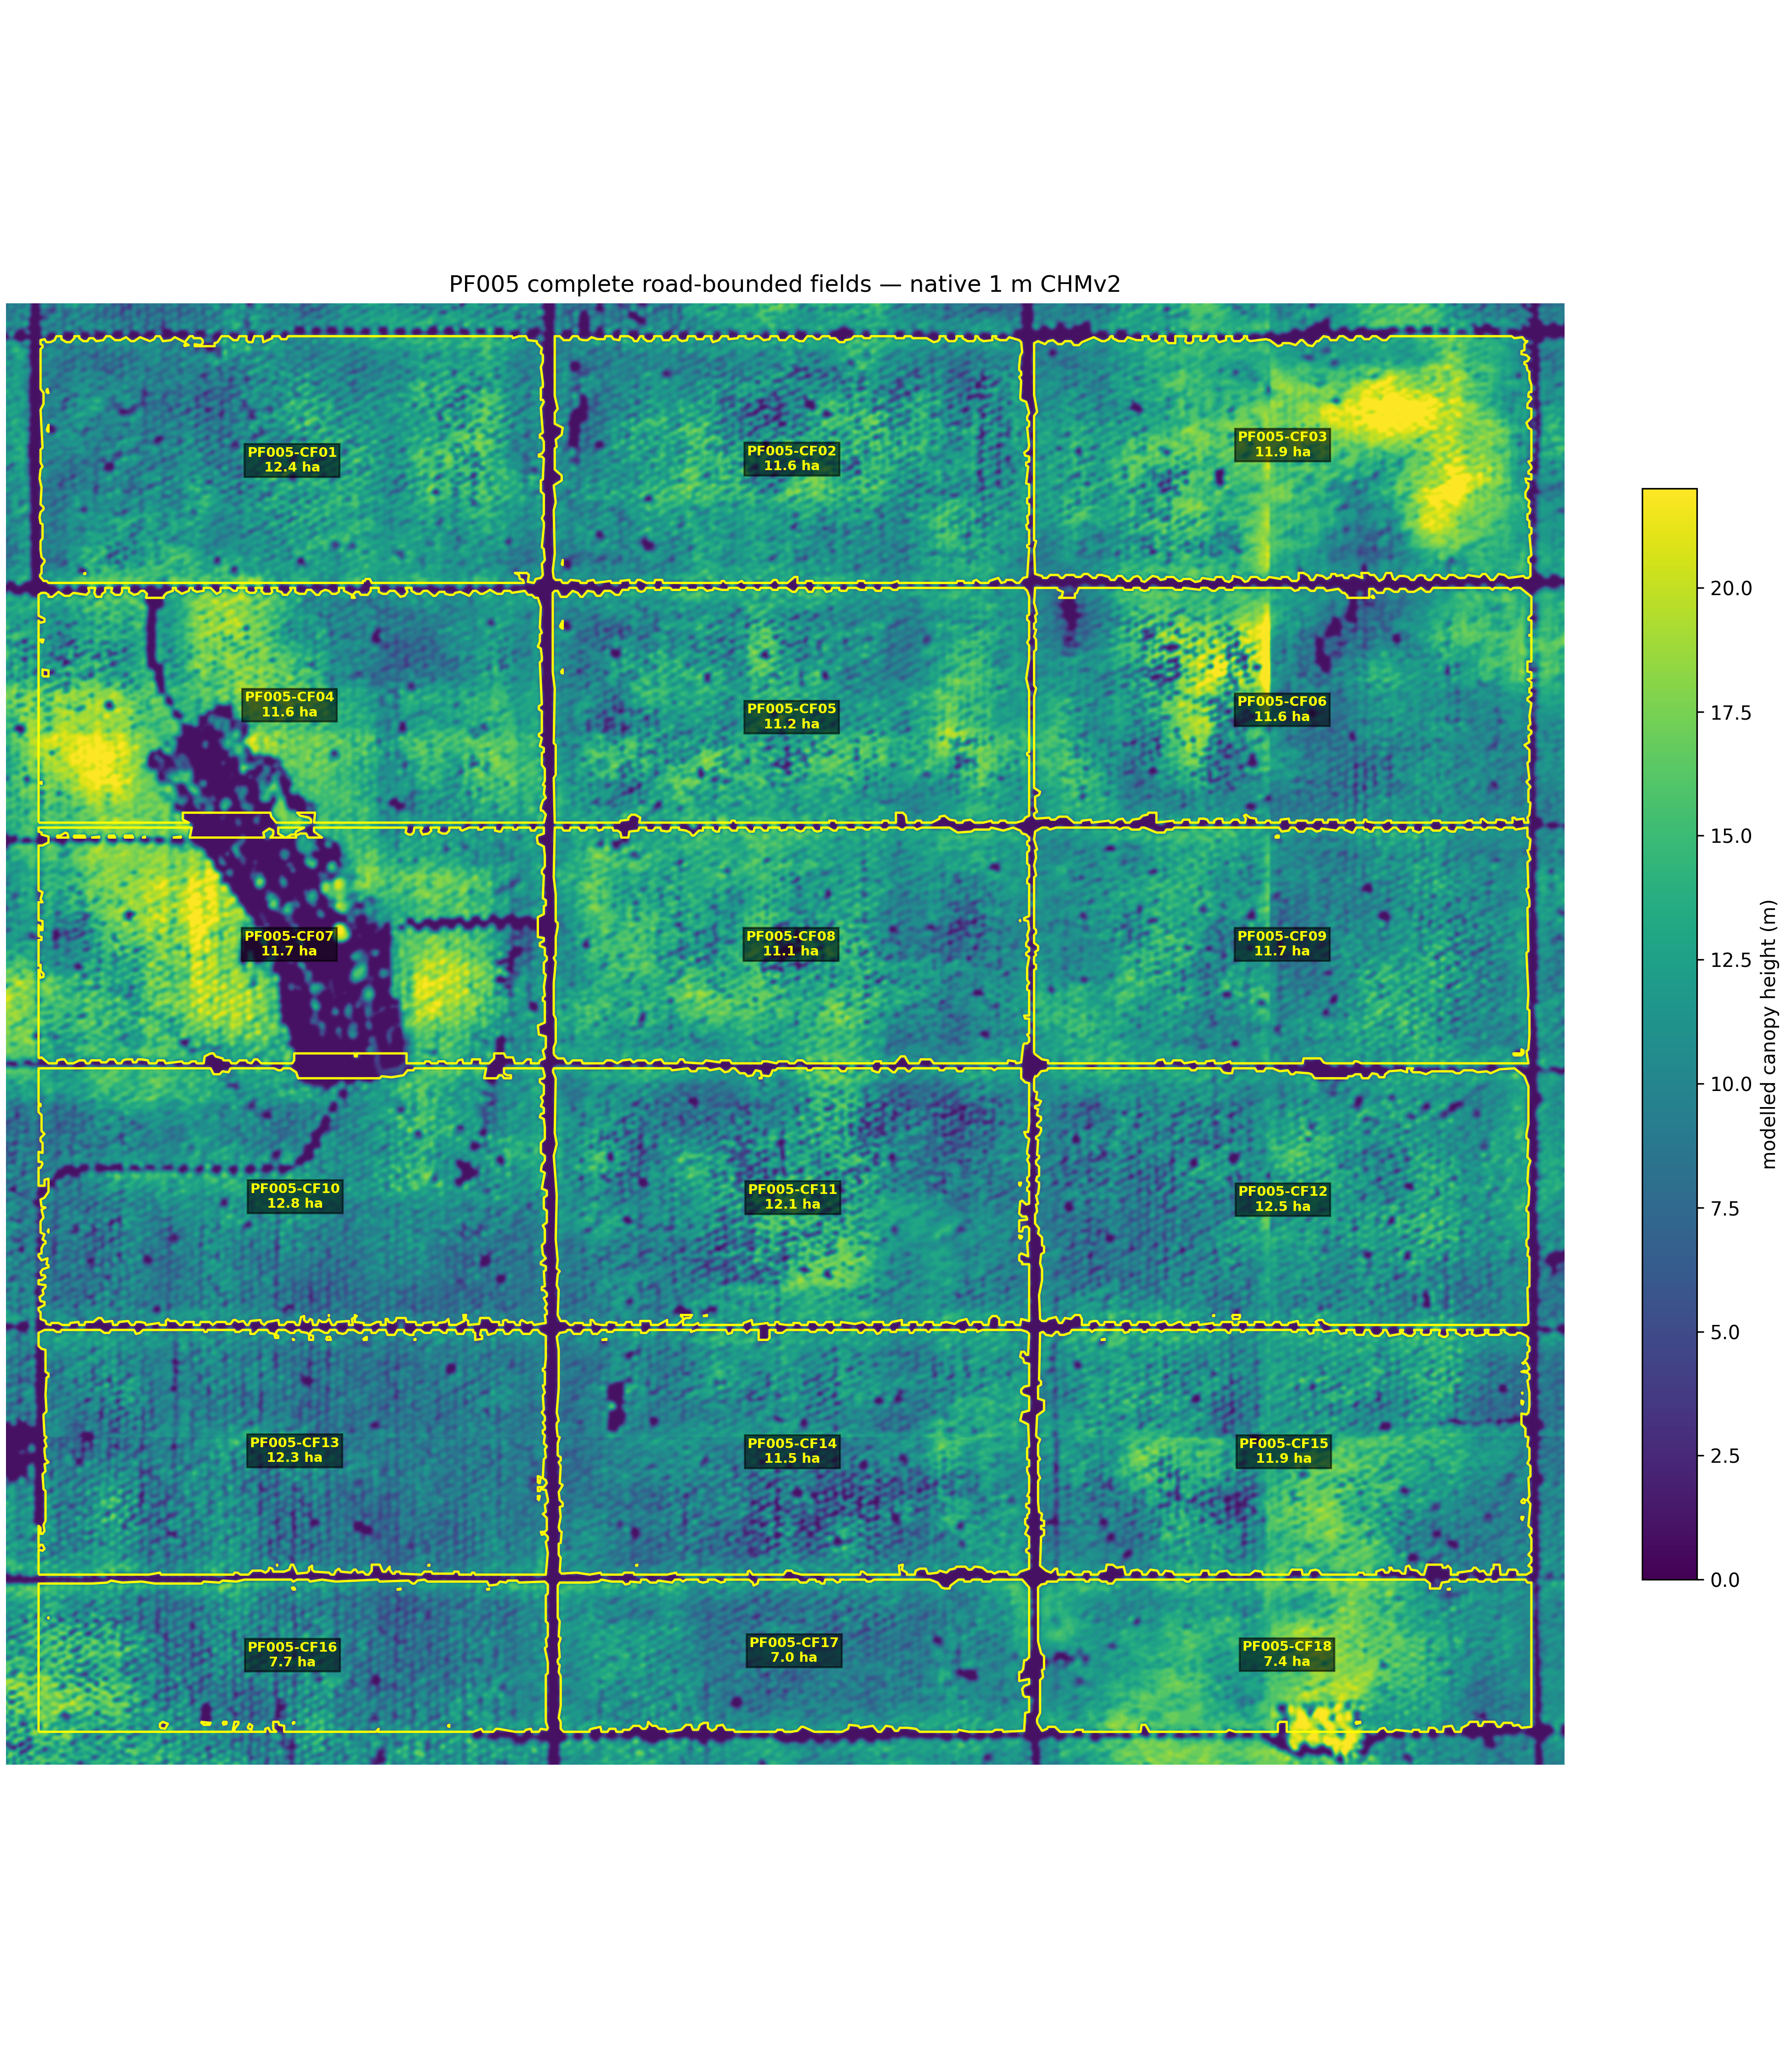
The optical imagery sequence showed when most tree-cover loss occurred within the area of interest. We now move from the landscape view to a canopy-height surface. The yellow rectangle (delineated area) from the previous section was divided into 18 complete fields using the low-canopy roads visible in the canopy-height surface.
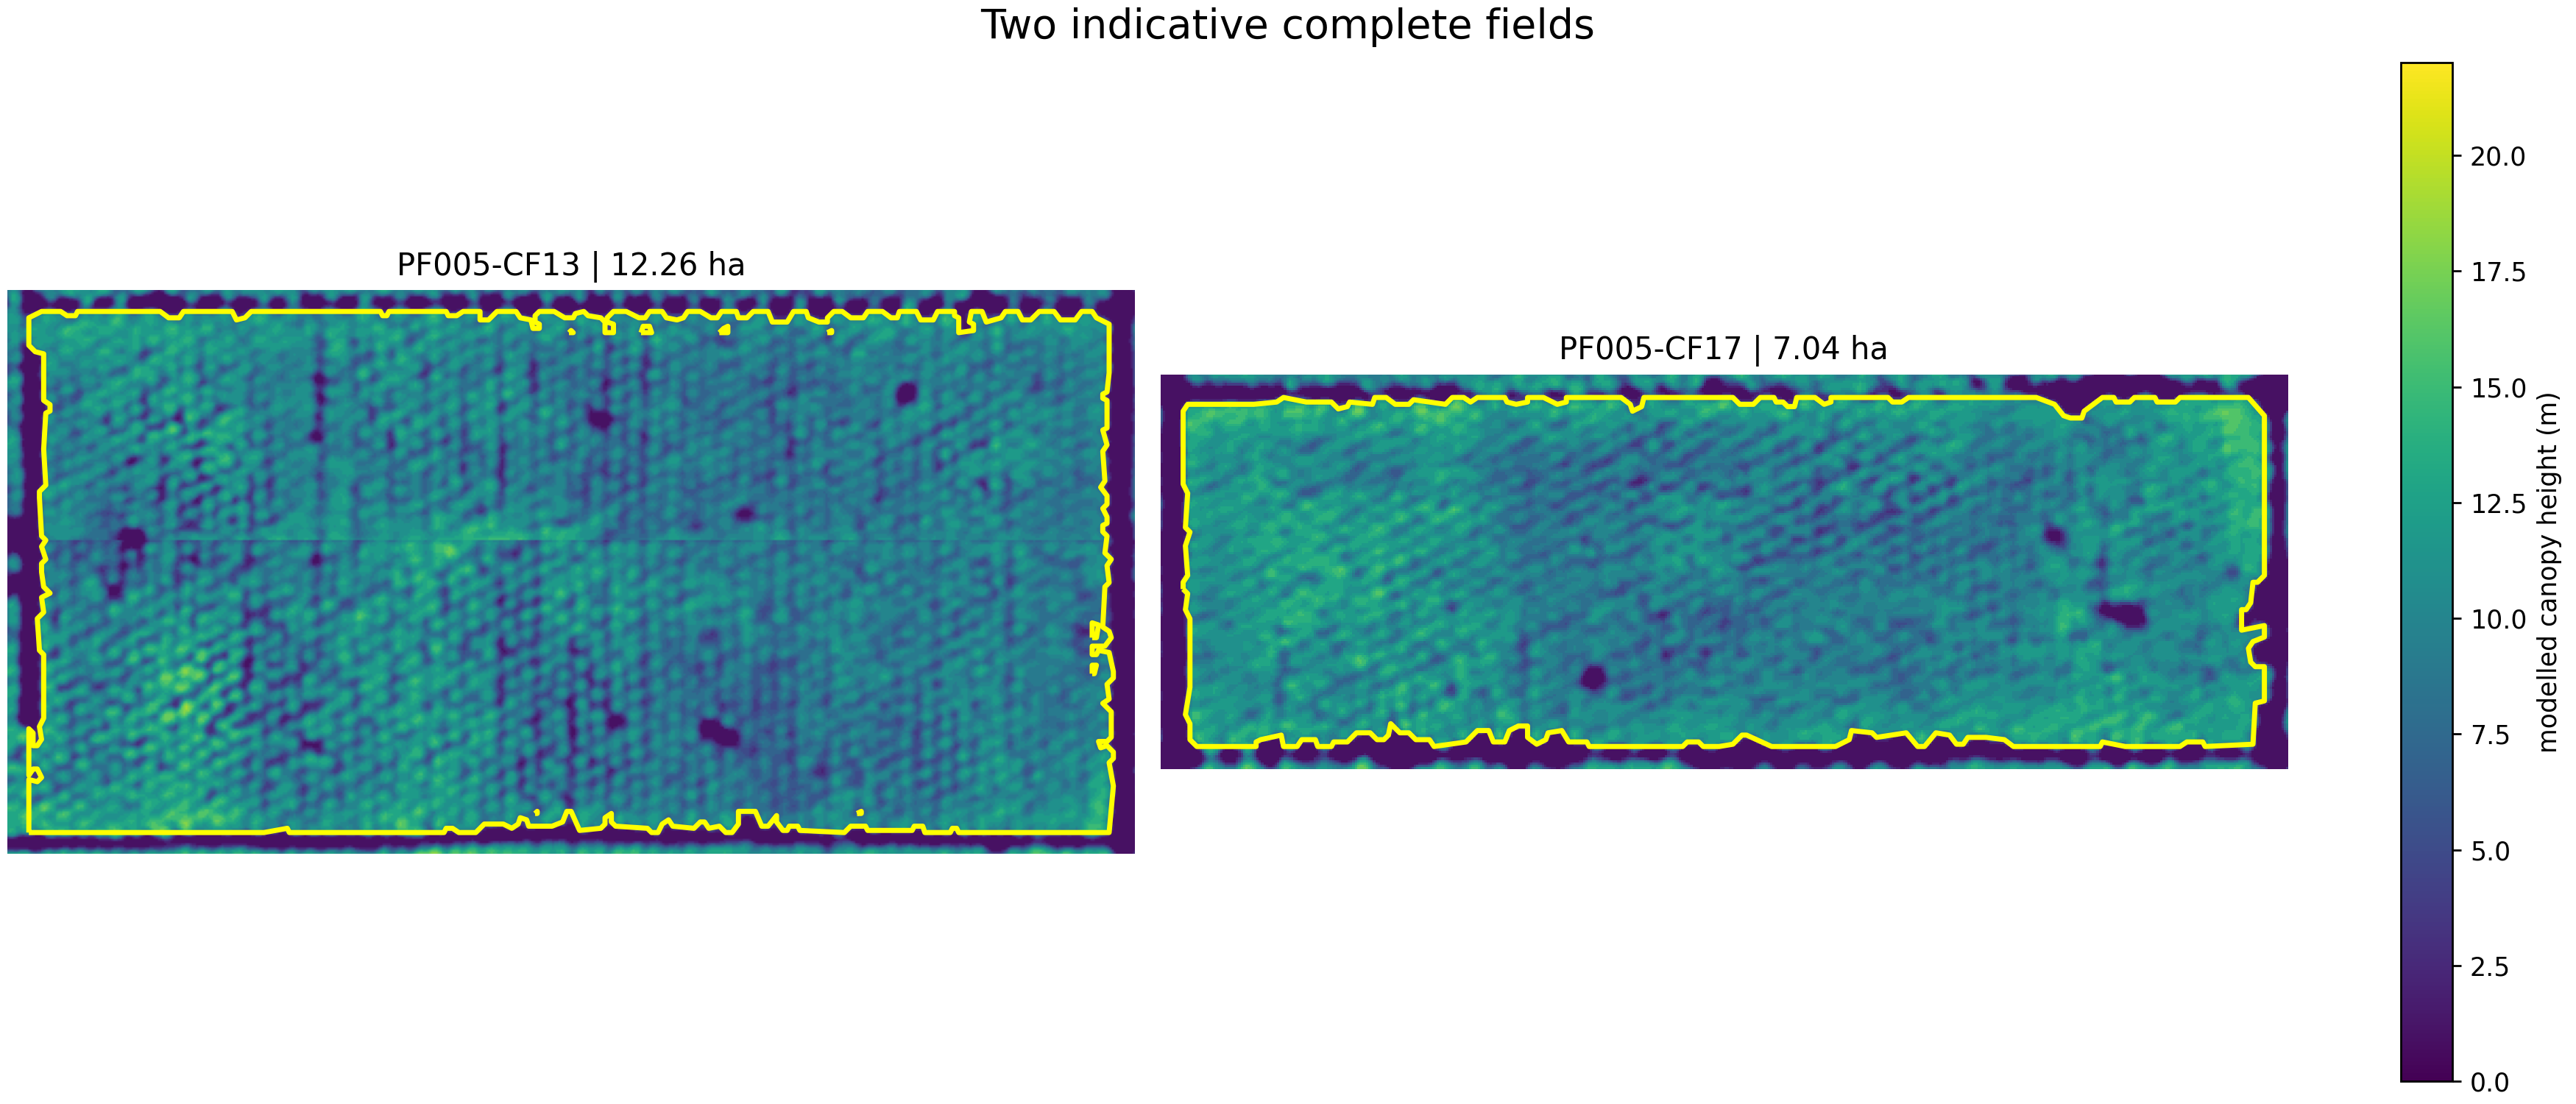
From those fields, we selected two indicative examples: PF005-CF13, a larger field of approximately 12.26 ha, and PF005-CF17, a smaller field of approximately 7.04 ha. Their yellow outlines follow the observed road edges and are analytical boundaries rather than cadastral parcels.
Separating canopy from gaps
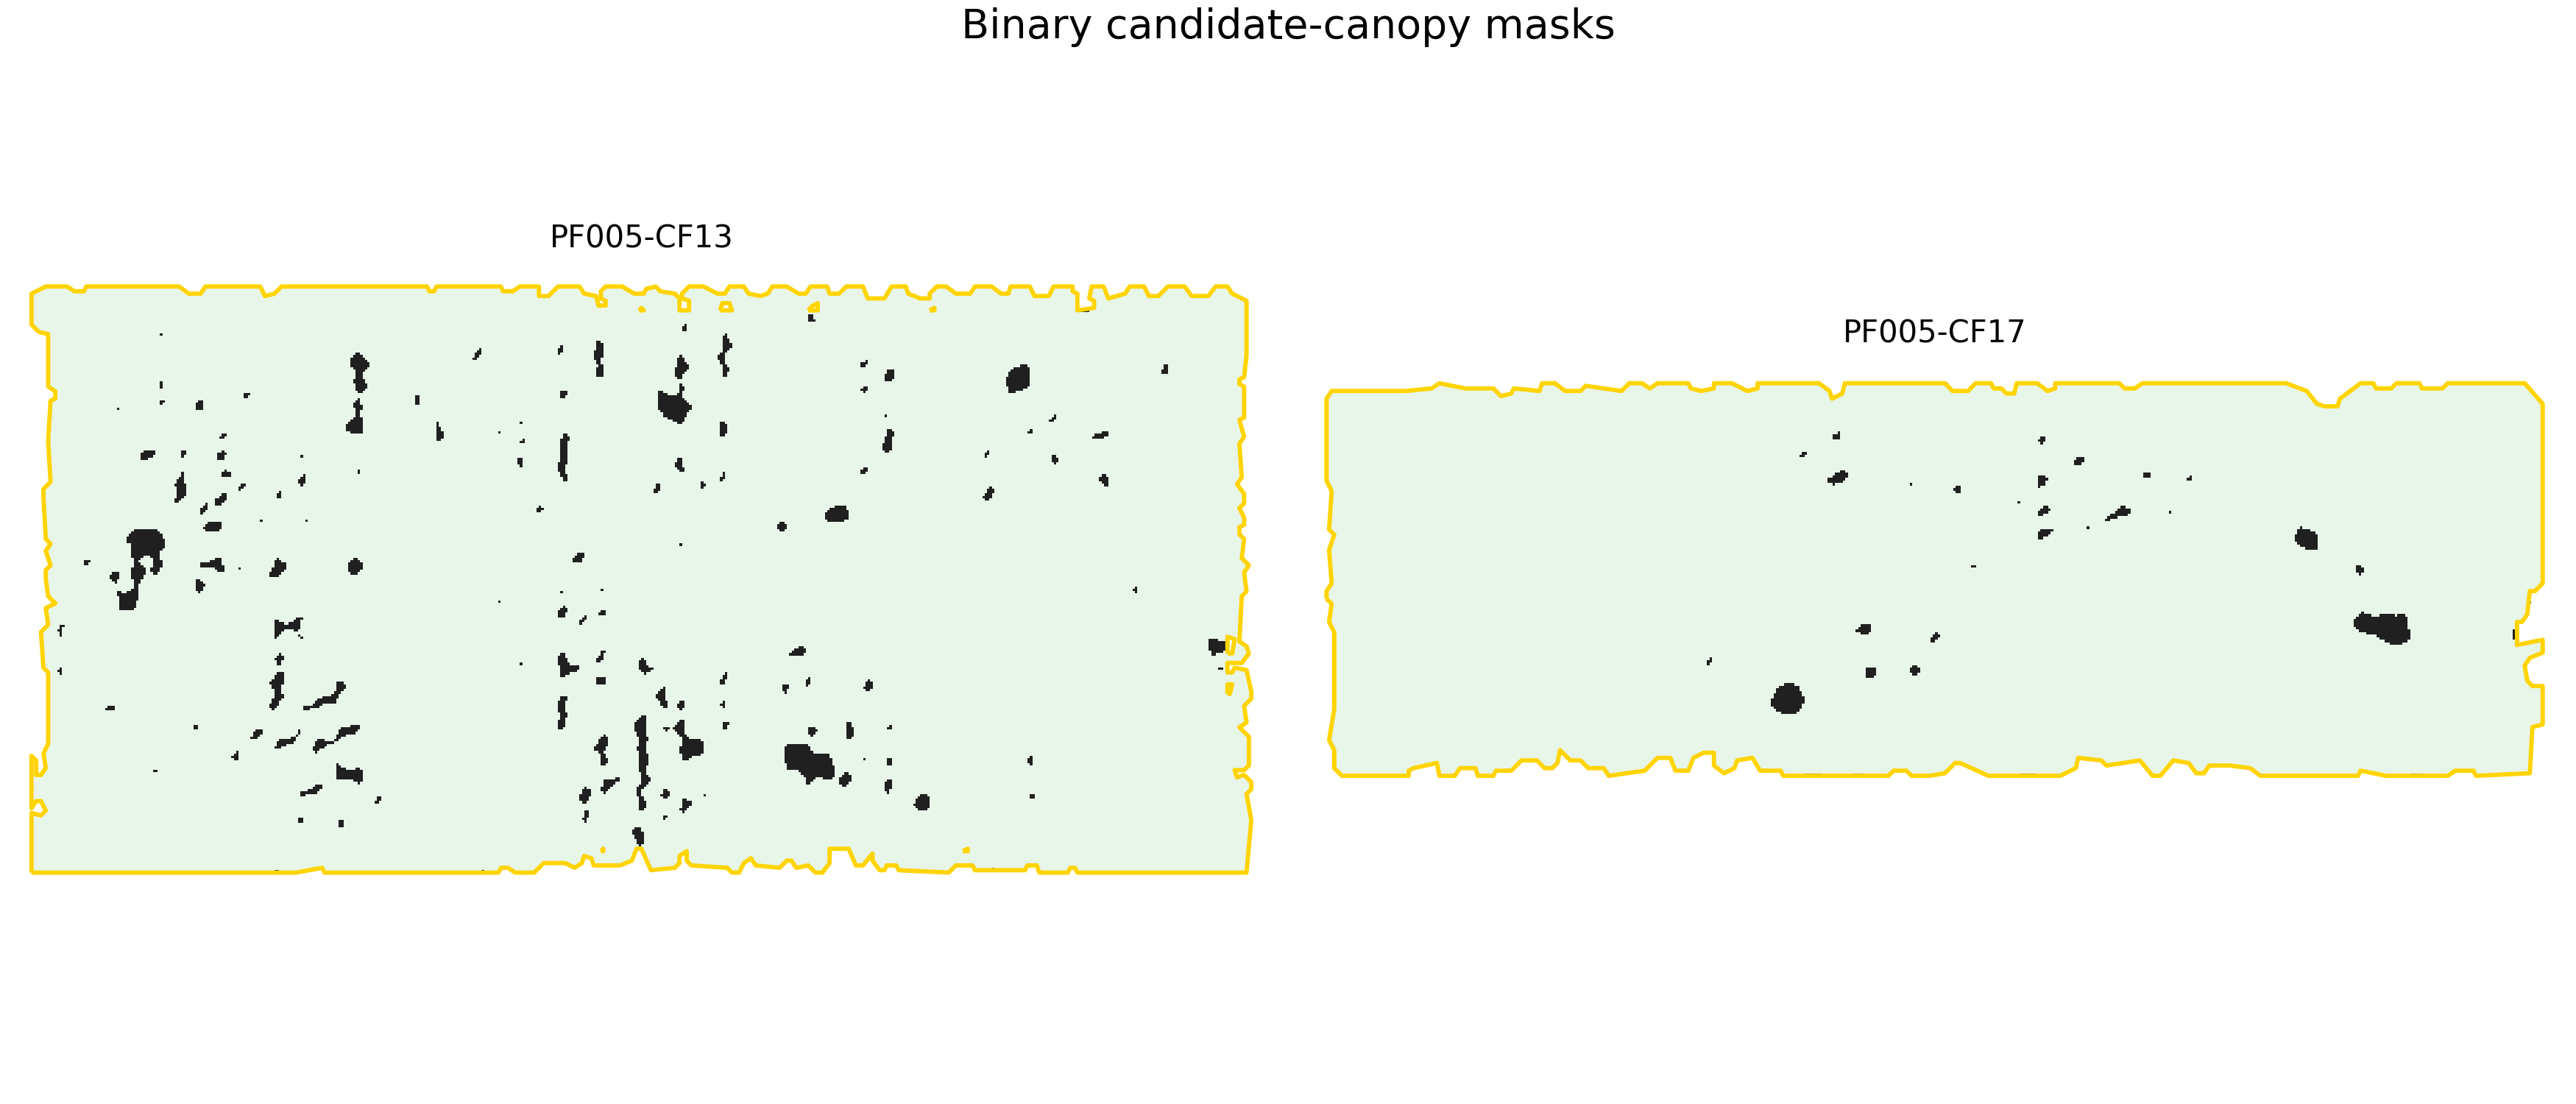
Within each field, the canopy-height surface was lightly smoothed to suppress isolated one-pixel height plateaus. Pixels with a modelled canopy height of at least 5 m were retained to create a canopy mask, removing roads, gaps and low vegetation before crown detection. Adjacent palm crowns frequently touch and may form a single connected region in this mask, making individual palms difficult to distinguish and count directly.
Detecting and delineating individual crowns
We detected candidate crown centres using a two-method ensemble across a 6–10 m planting-spacing range. Marker-controlled segmentation then expanded the accepted centres into separate crown instances, constrained by the canopy-height surface and a candidate canopy mask. A crown was assigned to a field only when at least half of its mask pixels overlapped that field.
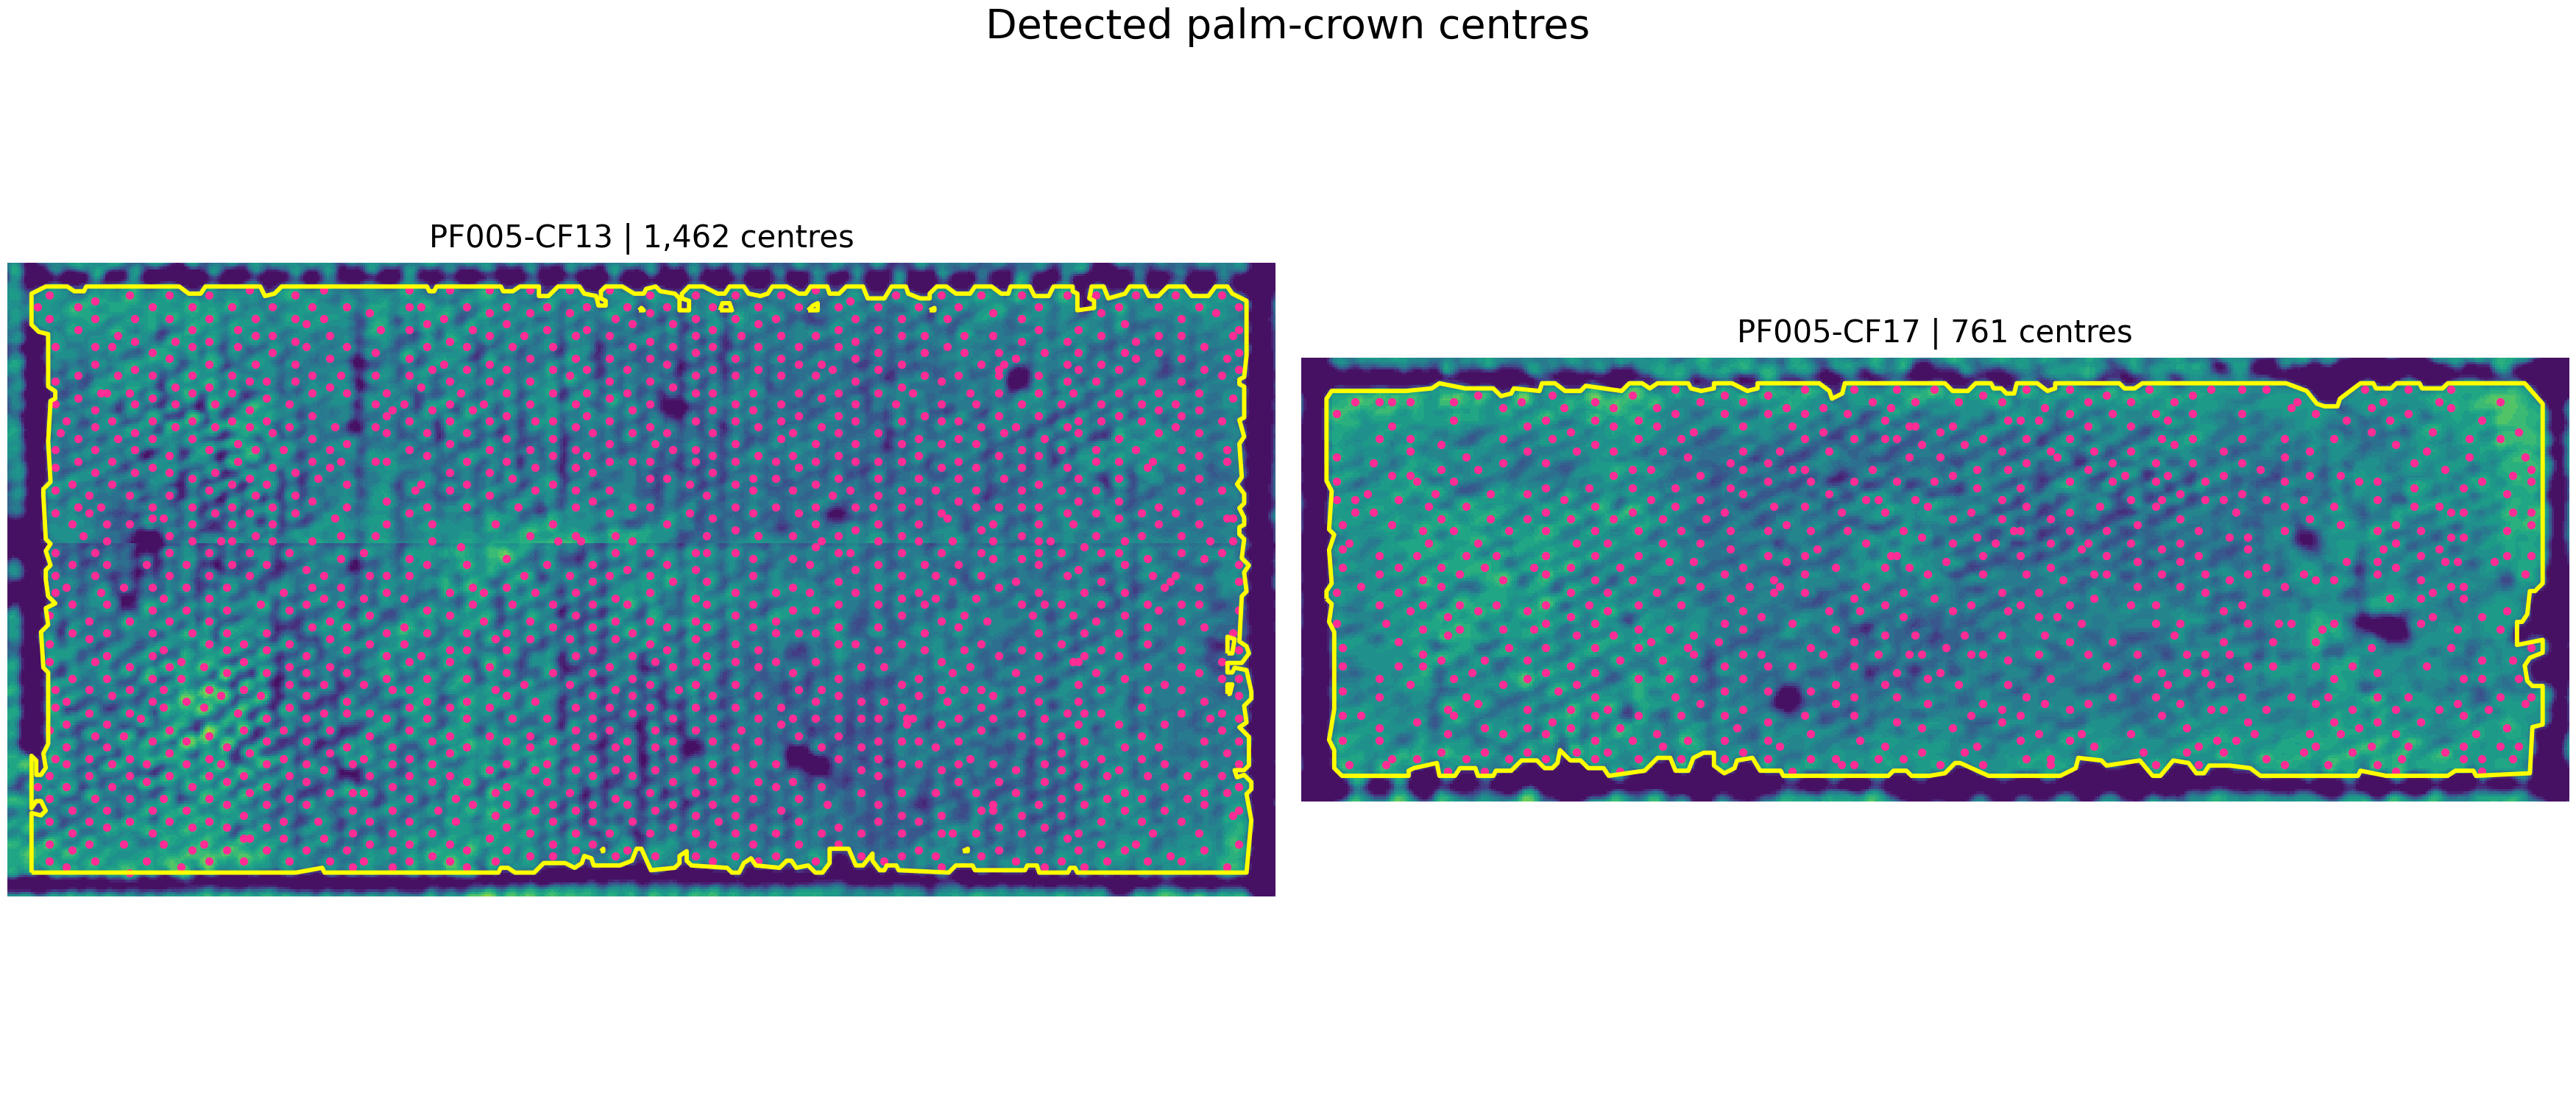
The larger CF13 field contains 1,462 detected crown instances, of which 95.9% were supported by both components of the ensemble. The smaller CF17 field contains 761 detected crown instances, with 90.9% supported by both components of the ensemble. These are direct counts of unique crown-mask IDs inside the field boundaries—not estimates derived from palms per hectare.
| Field | Field area (ha) | Detected canopy (ha) | Area without detected canopy (ha) | Area without detected canopy (%) | Detected palm crowns | Detected palms per field ha |
|---|---|---|---|---|---|---|
| PF005-CF13 | 12.26 | 11.96 | 0.30 | 2.47 | 1,462 | 119.2 |
| PF005-CF17 | 7.04 | 6.98 | 0.06 | 0.89 | 761 | 108.1 |
The table uses the two fields as large- and small-field samples. Applying the CF13 rate to fields of at least 10 ha and the CF17 rate to smaller fields, while adjusting each field for its proportion of detected canopy, gives an estimated 23,294 palms across all 18 delineated fields. Their combined field area is approximately 199.83 ha, of which 6.90 ha has no canopy detected above the 5 m threshold. “Area without detected canopy” is not necessarily unplanted land: it may also include spaces between crowns, roads, gaps, low vegetation or canopy omitted by the model. This 18-field total is therefore a sample-based estimate, unlike the direct crown-mask counts reported for CF13 and CF17.
The instance masks also allow us to describe crown structure. The mean equivalent palm-crown diameter is 10.19 m in CF13 and 10.77 m in CF17; the median of the maximum modelled crown heights is 12 m in both fields. Median nearest-neighbour spacing is approximately 7.2 m in each field. These measurements come from a modelled canopy-height surface, so they should be interpreted as remote-sensing estimates rather than field measurements. Merged crowns, weak canopy peaks and trees intersecting a field boundary remain possible sources of omission or commission error.
3. From palm counts to yield estimates
The crown masks tell us how many palms were detected and how much of each field supports canopy, but canopy height does not measure fruit production. We therefore estimate yield by combining the mapped canopy area with a regional productivity benchmark. Most clearing within the area of interest occurred in 2008–2009, while the canopy-height surface dates from 2019. If planting followed soon after clearing, the palms were approximately 9–10 years old when observed—a productive mature stage. This age is an inference, not a known planting date.
A regional yield benchmark for the area of interest
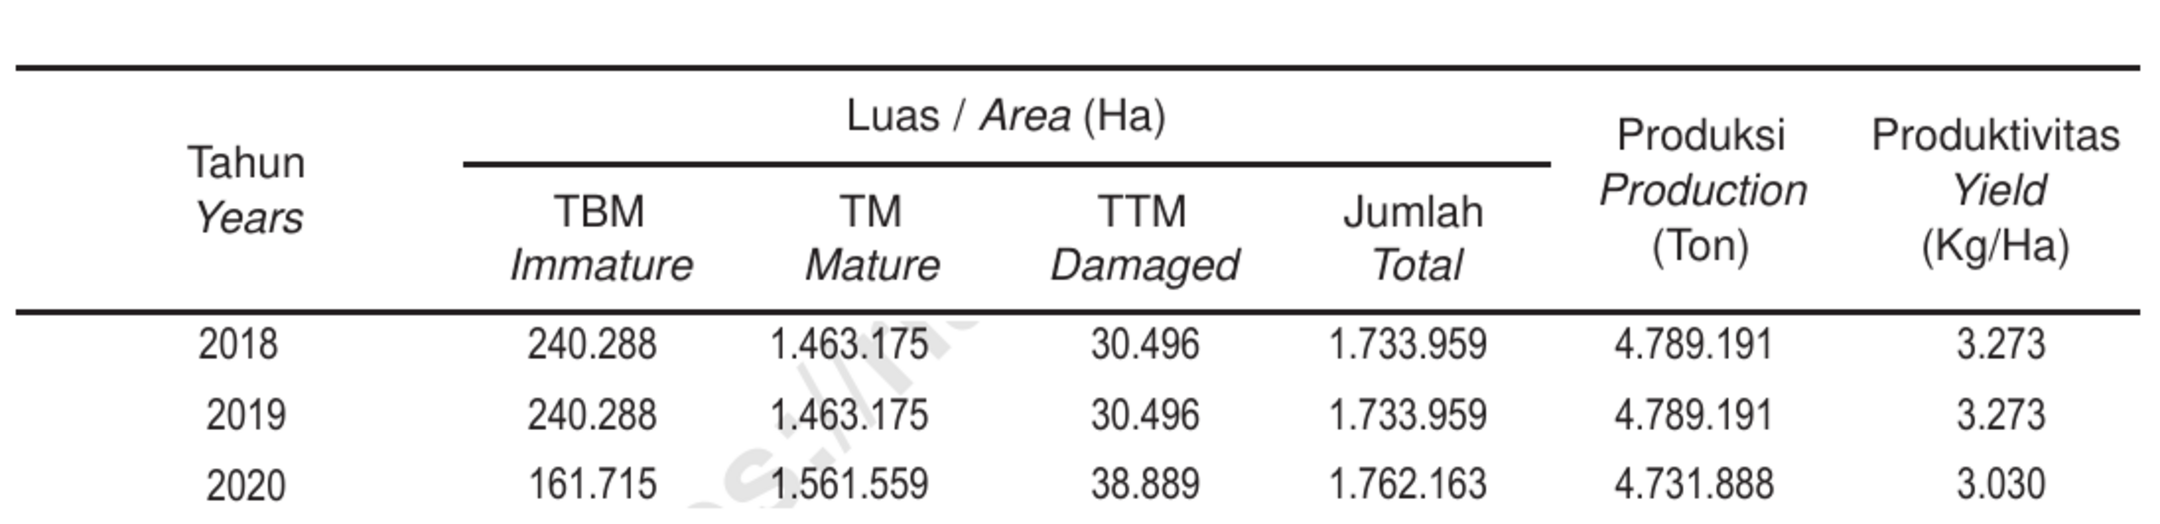
The official Oil Palm Statistics of Riau Province 2023 reports smallholder crude palm oil (CPO) productivity from 2006 to 2023. We use the 2019 value of 3,273 kg (3.273 tonnes) of CPO per mature hectare per year as the central benchmark because it matches the year of the canopy-height surface.
Indonesia’s Directorate of Oil Palm and Palm Crops uses an approximate 20% CPO extraction rate from fresh fruit bunches (FFB).
Applying this official conversion factor gives 16.365 tonnes of FFB per mature hectare per year. The actual extraction rate of the mill receiving fruit from this area is unknown, so the CPO estimate is more directly supported than the converted FFB estimate.
We apply this rate only to the area retained by the 5 m canopy mask, rather than to the full field area. The resulting estimate is therefore:
annual FFB = detected-canopy area × 16.365 t FFB/ha/year
CF13, CF17 and the complete 18-field inventory
| Field | Palm-count basis | Gross area (ha) | Detected canopy (ha) | Estimated FFB (t/year) | CPO-equivalent (t/year) | Implied FFB (kg/palm/year) |
|---|---|---|---|---|---|---|
| PF005-CF13 | 1,462 direct crown-mask IDs | 12.26 | 11.96 | 195.7 | 39.1 | 133.9 |
| PF005-CF17 | 761 direct crown-mask IDs | 7.04 | 6.98 | 114.2 | 22.8 | 150.1 |
| All 18 fields | 23,294 sample-based palm estimate | 199.83 | 192.94 | 3,157 | 631 | 135.5 |
Closing remarks
By combining historical optical imagery, tree-cover-loss data and canopy-height mapping, this analysis follows one landscape from clearing to field delineation, individual palm detection and indicative yield estimation. The workflow shows how open geospatial data can connect past land-cover change with present-day plantation structure while keeping direct observations separate from inferred results. The field boundaries, palm counts and yield figures are analytical estimates rather than cadastral records or measured harvests, but together they provide a reproducible basis for plantation-scale monitoring.
This analysis does not establish the legality of the clearing, land ownership, supplier identity, measured crop yield, harvest or shipment history, or regulatory compliance; those determinations require traceability records, parcel documentation, authorization data and, where uncertainty remains, additional independent evidence.
Attribution:
- Landsat imagery: USGS Landsat Collection 2 Level-2 surface-reflectance data, accessed through Microsoft Planetary Computer. USGS-authored Landsat data are public domain. Cloud, shadow, cirrus, snow, saturation and no-data were screened using
QA_PIXEL. - Tree-cover loss: Hansen Global Forest Change v1.13 (2000–2025), licensed under CC BY 4.0. The dataset records tree-cover-loss year at approximately 30 m; mapped loss is not synonymous with primary-forest conversion and does not identify a commodity driver.
- Canopy height: Meta and World Resources Institute (WRI), 2026, Version 2 High Resolution Canopy Height Maps (CHMv2), licensed under CC BY 4.0. Source imagery for CHM © 2016 Vantor. The CHMv2 surface used here dates from 2019.
- Derived boundaries and palm crowns: Field boundaries, canopy masks, crown centres and crown-instance masks were generated for this analysis. Field boundaries are analytical units rather than cadastral parcels.
- Regional productivity: BPS-Statistics Indonesia, Oil Palm Statistics of Riau Province 2023. The publication combines plantation survey data with smallholder data from Indonesia’s Directorate General of Estates.
- CPO extraction factor: The approximate 20% conversion from FFB to CPO comes from the Directorate of Oil Palm and Palm Crops’ 2025 performance report, listed as item 3 under the official 2025 LAKIN publications. It should be replaced with mill-specific data when available.
- Series connection: Previous Monopteryx article on soybean, oil palm and olive crop grids.
Monopteryx combines satellite change analysis, field delineation, canopy-height modelling, object-level tree counting and production scenarios for agricultural due diligence.