Ground movement becomes important when a decision depends on how a site has behaved over time. The difficulty is not producing a coloured velocity map. It is establishing whether the marked areas are real, whether the measurement repeats, what physical surfaces they correspond to and where confidence should stop.
Satellite radar can examine a defined site retrospectively, including periods before ground instruments were installed. But a useful result needs more than displacement values. It needs evidence that the signal survives a different set of satellite images, that apparently still ground remains centred on zero, and that the uncertainty reflects the conditions of the site rather than a generic claim of precision.
We use archive Sentinel-1 radar to produce area-based ground-motion measurements and place those checks beside the result. Sentinel-2 imagery adds physical context where it helps identify the measured surface. The output is measurement rather than engineering judgement, designed to sit inside a wider technical assessment rather than compete with it.
To demonstrate that structure end to end, we used two public mining sites at Riotinto and Cobre Las Cruces in Andalucia, Spain. Both were measured from the same orbit using the same 91 Sentinel-1 passes, from 3 January 2018 to 27 June 2019. The satellite dates and viewing geometry are held constant; only the ground changes.
Riotinto and Las Cruces formed a matched pair on the same sub-swath: Riotinto was the control, while Las Cruces supplied a published displacement figure, which our measurement did not reproduce. Amyntaio, Greece, was considered, but our literature review found no published displacement value suitable for comparison. Our feasibility review set aside an unnamed tropical tailings facility and disused coal tips in South Wales because wet, vegetated surfaces pose coherence risks for this Sentinel-1 test. ESA explains how vegetation change and rainfall can disrupt interferometric coherence, and why longer-wavelength L-band can perform better through vegetation. Cadia, Australia, falls outside the European Ground Motion Service coverage and did not match the Spanish acquisition geometry. We chose the sites to test the method, not the method to suit the sites.
The sites are test cases, not the limit of what can be assessed, and neither operator is a client. One provides a well-documented historical event; the other tests whether the method remains quiet away from active workings. The measurements are retrospective and do not imply a current condition at either operation.
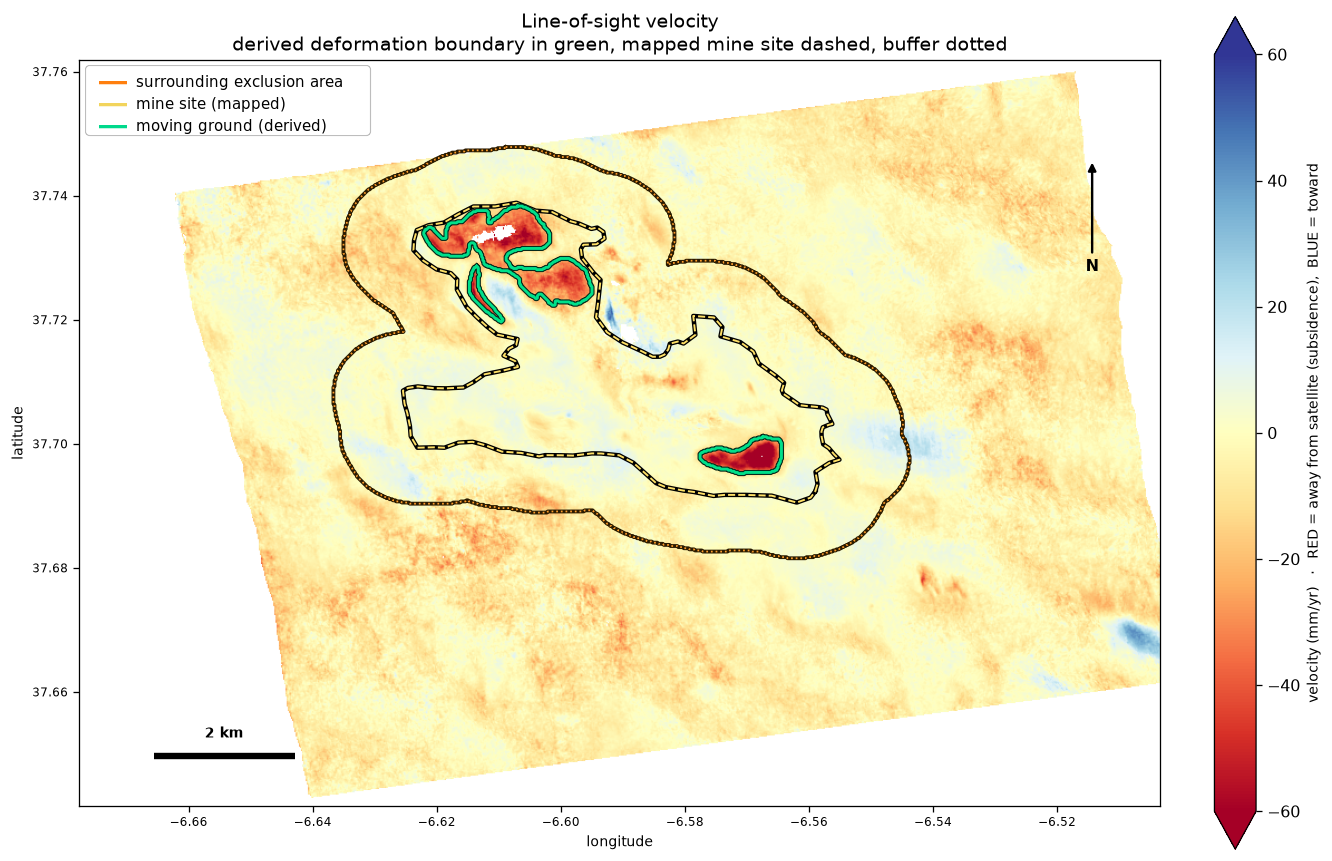
At Riotinto, zero hectares of the 9,766.7 ha outside the mine and its surrounding exclusion area crossed the movement threshold. Inside the mapped site, the three areas that did cross it are the expected signatures of an operating mine: two sit on tailings surfaces and one on the working area east of the pit.
1. Assessment deliverables
Each assessment provides:
- radar-derived moving areas, line-of-sight rates and area-median time series;
- a repeatability result for every reported area;
- a still-ground verdict and scene-specific uncertainty;
- optical context identifying the surfaces beneath the radar-derived outlines; and
- a clear record of the result's limitations.
The areas are derived from the measurements rather than drawn by hand. The report is generated consistently, and the checks appear beside the result rather than being left for the reader to request.
At Riotinto, all three reported areas repeat across the split runs, with line-of-sight rate differences of 1.4, -0.8 and -1.6 mm/yr. Ground outside the mine and exclusion area contributes 0.0 ha above the scene-derived threshold. This is a result for this site and time window, not a universal false-alarm rate.
2. Riotinto: a clean control result
At Riotinto, the three moving areas are expected signatures of mine working: patches 1 and 3 sit on tailings surfaces, while patch 2 sits on the working area east of the pit. The optical overlay supplies that attribution; the outlines and every displacement value come from the radar measurement.
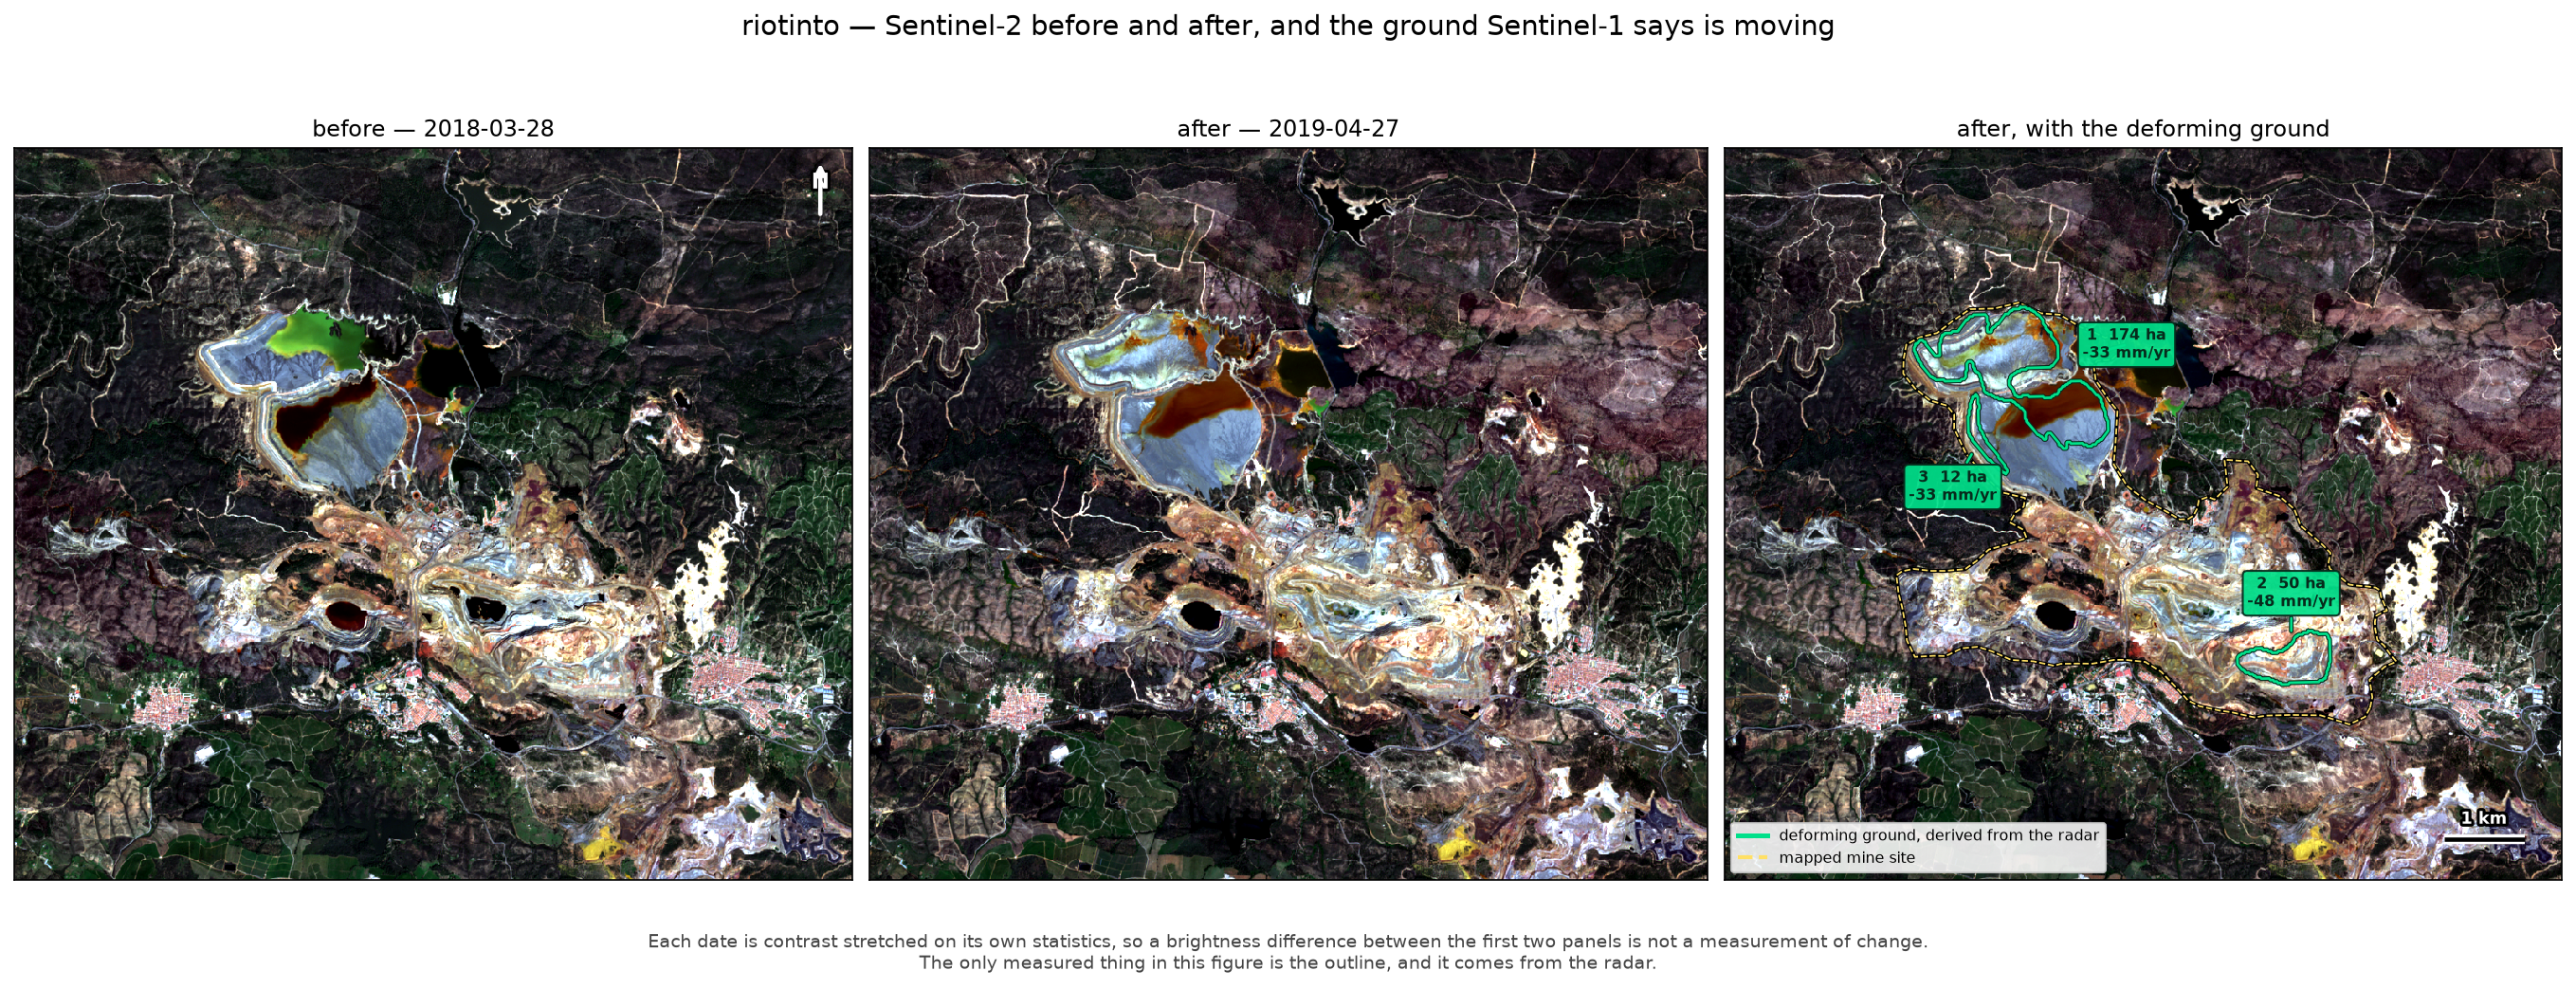
The optical panels provide site context, not change detection. Each date is contrast-stretched independently, so brightness differences between them are not measurements.
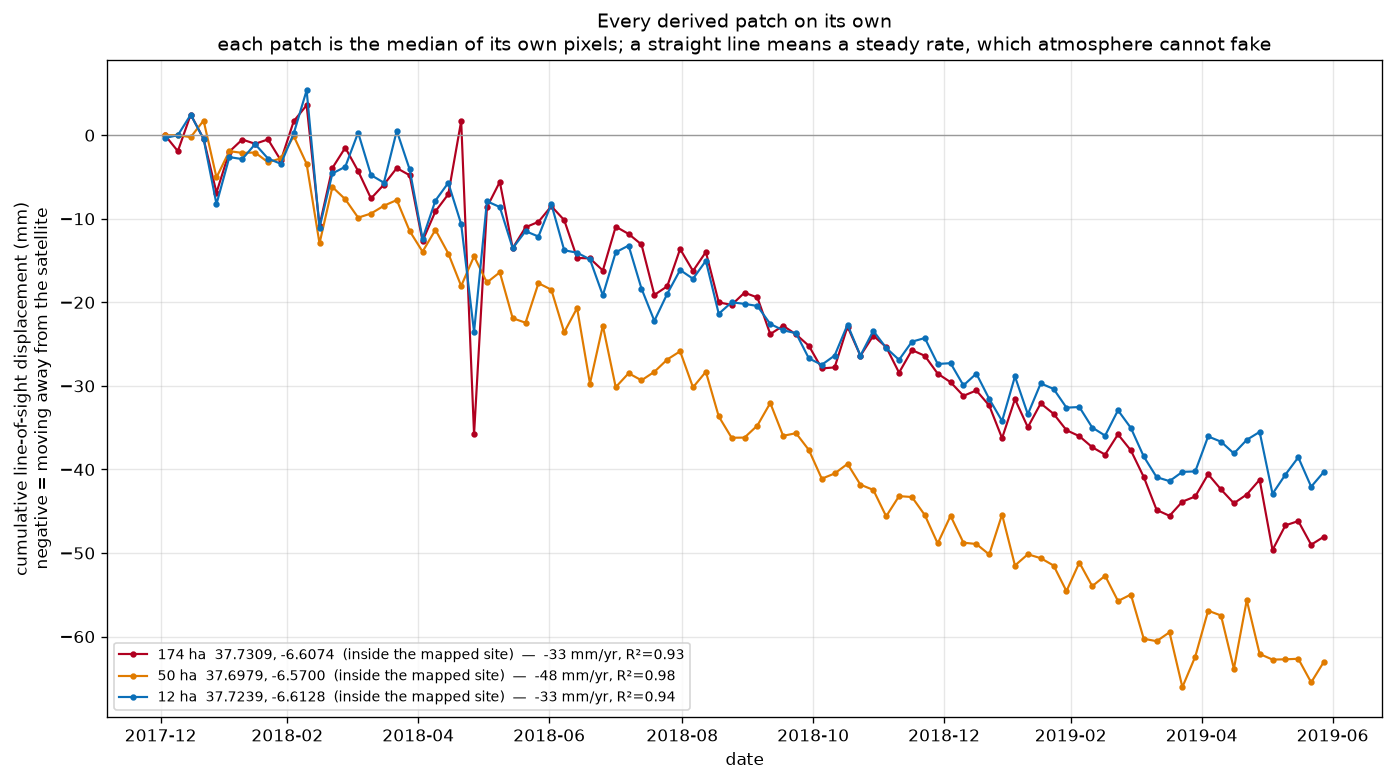
The three Riotinto area medians are -32.9, -47.8 and -33.1 mm/yr along the satellite line of sight, over 174.11, 50.08 and 12.33 ha respectively. Their straight trends have R² values of 0.927, 0.983 and 0.943. They describe excavation and consolidation associated with mine working, not evidence of instability.
3. Las Cruces: the limits stay with the result
Cobre Las Cruces provides the more demanding case. A slope failure in January 2019 is documented in the public record and peer-reviewed literature, but this result is not presented as a numerical reproduction of the published study. The supplied mine polygon covers the working pit, so excavation and slope movement are mixed within the largest reported area.
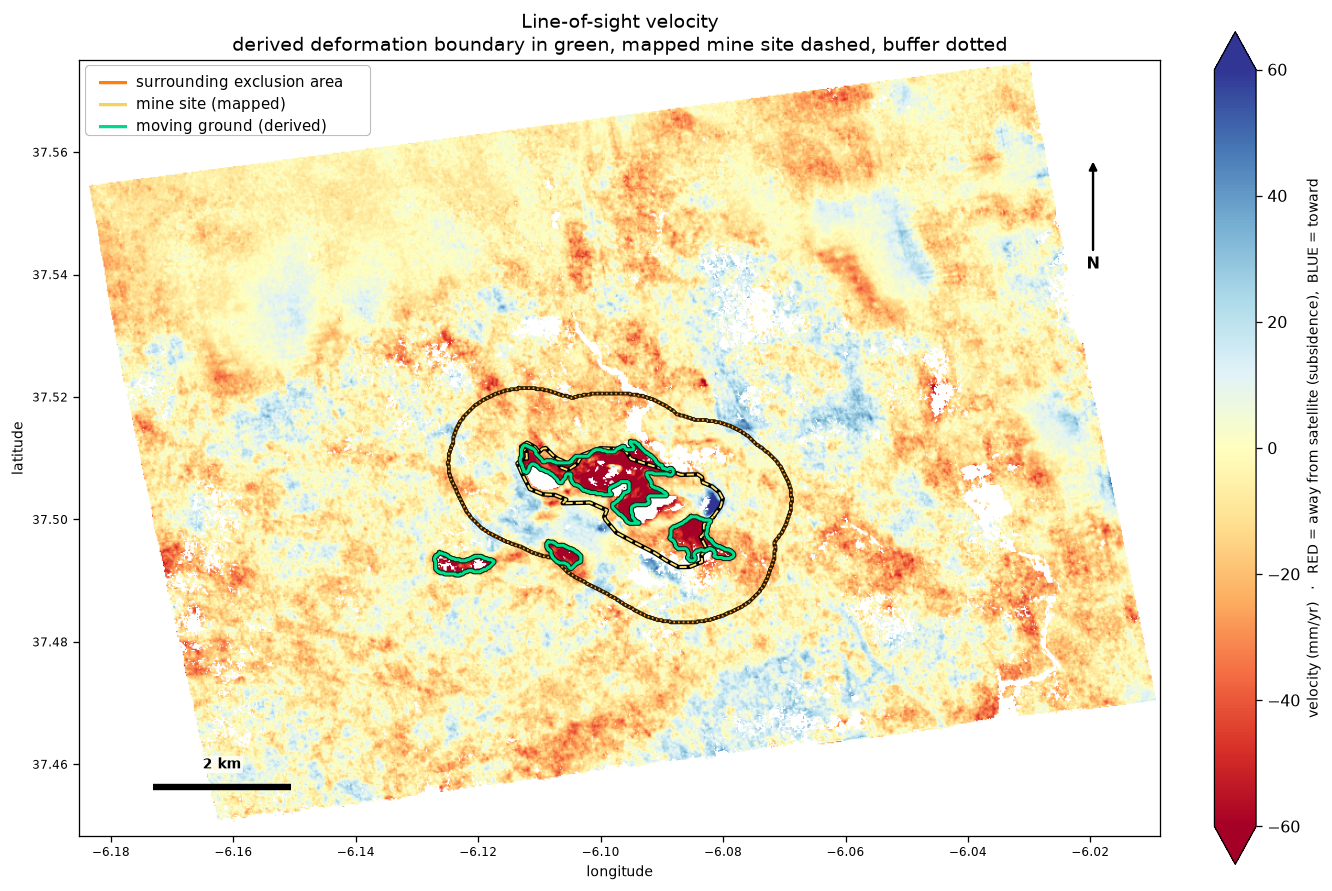
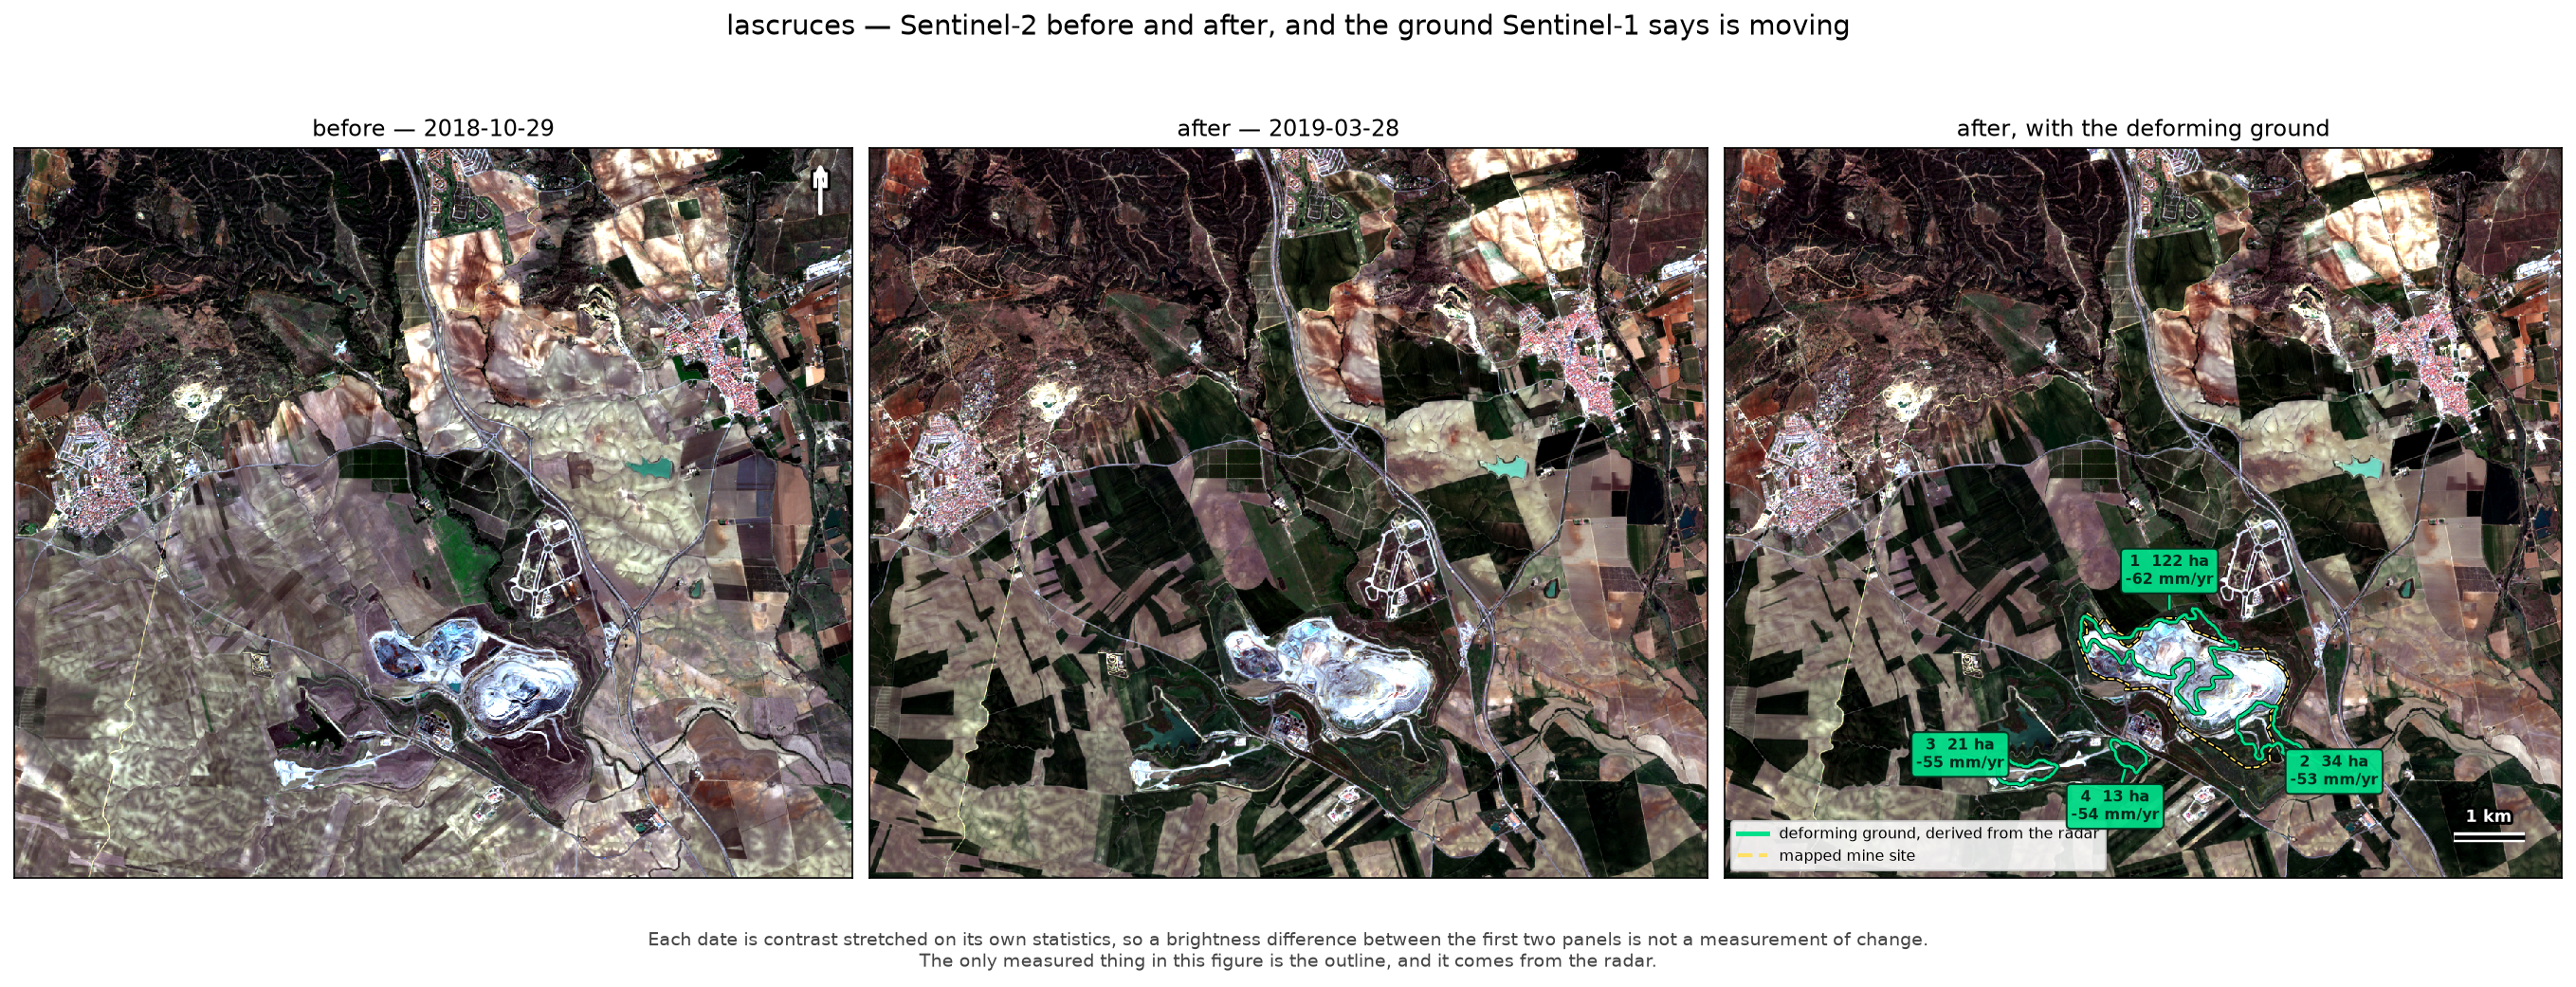
The optical panels are independently contrast-stretched context images, not change detection. The measured overlay is the radar-derived outline.
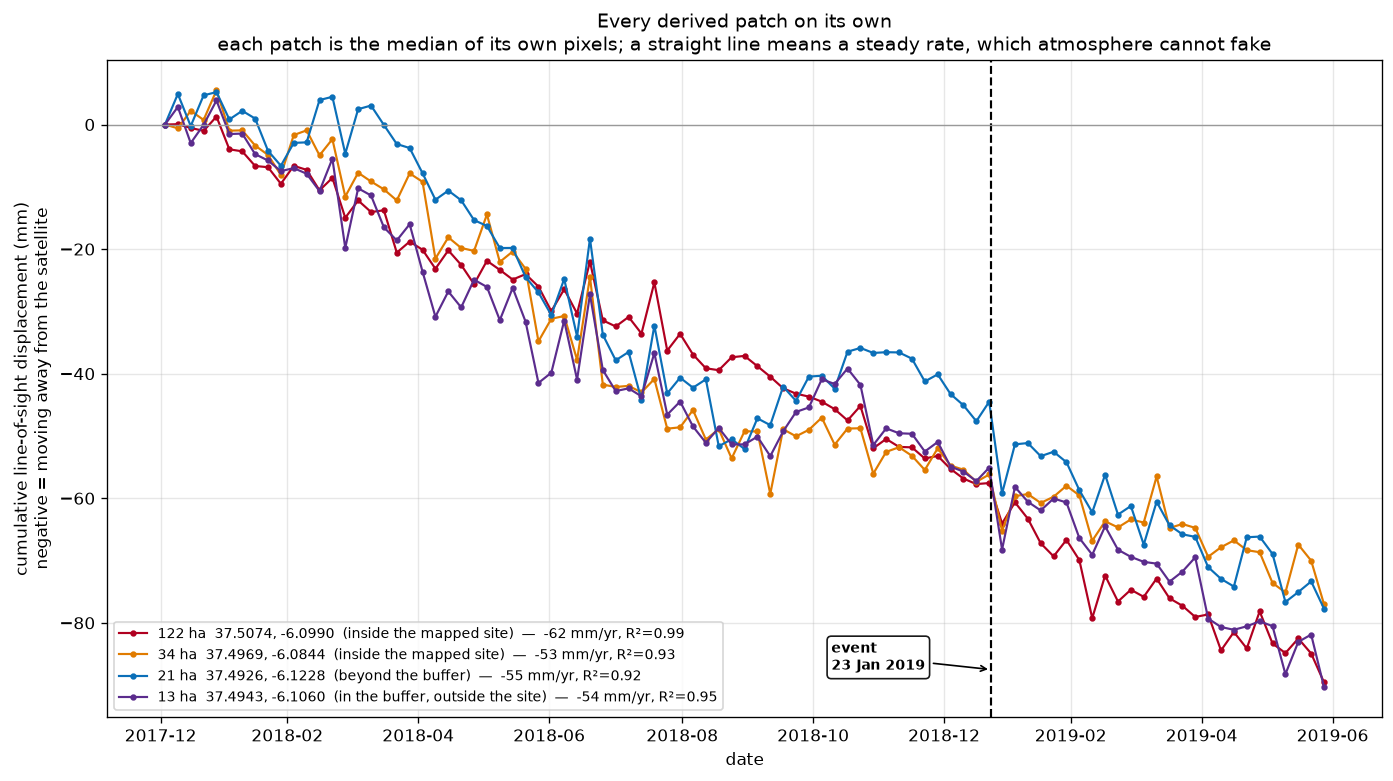
The four derived areas have median rates of -62.4, -53.2, -54.6 and -53.5 mm/yr along the satellite line of sight, over 122.43, 34.3, 20.97 and 12.84 ha. Their split-run rate differences are -9.7, -10.4, 1.0 and -9.1 mm/yr. This is the weaker of the two scenes: apparently still ground has a robust spread of 10.51 mm/yr, compared with 5.88 mm/yr at Riotinto.
The measured rate remains close to constant through the event, and the acceleration described in the published study is not resolved. The result supports a narrower statement: movement was measurable during the preceding year.
Two radar-derived areas fall beyond the supplied site polygon, which stops at the pit and plant. The optical imagery places both on the mine’s tailings and water-management facility to the south-west. They are mine workings omitted by the drawn boundary, not detections on unrelated ground.
The 20.97 ha area is especially useful: its split runs return -49.8 and -50.8 mm/yr along the satellite line of sight, the closest match among the four Las Cruces areas. The optical image places it on a deposited surface beside the pond, not on water. Describing it more specifically would go beyond what the imagery establishes.
4. Evidence for different decisions
Using archive data, we can assess a defined area and time window retrospectively, without equipment installation or a site visit. Each result combines mapped ground-motion measurements with optical context, verification checks and stated limitations.
The same evidence package can support a range of decisions: establishing a historical baseline, identifying areas that merit closer review, comparing activity across sites or periods, documenting conditions before development and prioritising where further assessment is most valuable. It can be applied to an individual site or a wider portfolio and repeated on an agreed cadence.
A fixed-scope pilot can begin with a familiar site, allowing the satellite result to be assessed against existing knowledge before the scope expands. The deliverable is a report containing the area-based measurements, optical context, verification checks and limitations.
The report is designed for review: its results are computed and reproducible, nothing is transcribed by hand, and limitations appear alongside the findings.
This article is a retrospective demonstration based on public satellite data and the stated analysis inputs, not a current assessment of either site or a safety, engineering or regulatory determination. Although we have checked the results, the data and interpretations may contain errors or omissions and cannot establish future ground behaviour. Decisions affecting safety, property, operations or compliance require independent, site-specific verification by appropriately qualified professionals; this article should not be relied on alone for those decisions.
Attribution
- Radar data and derived figures: Contains modified Copernicus Sentinel-1 data from 3 January 2018 to 27 June 2019. The velocity maps, moving-area outlines, time series and statistics were produced by Monopteryx from the public archive acquisitions; the two named operators were not involved and are not clients.
- Optical context: Contains modified Copernicus Sentinel-2 data from 28 March 2018, 29 October 2018, 28 March 2019 and 27 April 2019. Sentinel-2 is used only to identify the ground beneath radar-derived outlines.
- Site boundaries: The polygons shown are supplied analysis inputs used to group the measurements. They are not presented as official property, concession or operational boundaries.
- Historical reference: López-Vinielles et al. (2020), Remote analysis of an open-pit slope failure: Las Cruces case study, Spain, is the reason Las Cruces provides a documented method case. This analysis does not claim numerical agreement with that study.
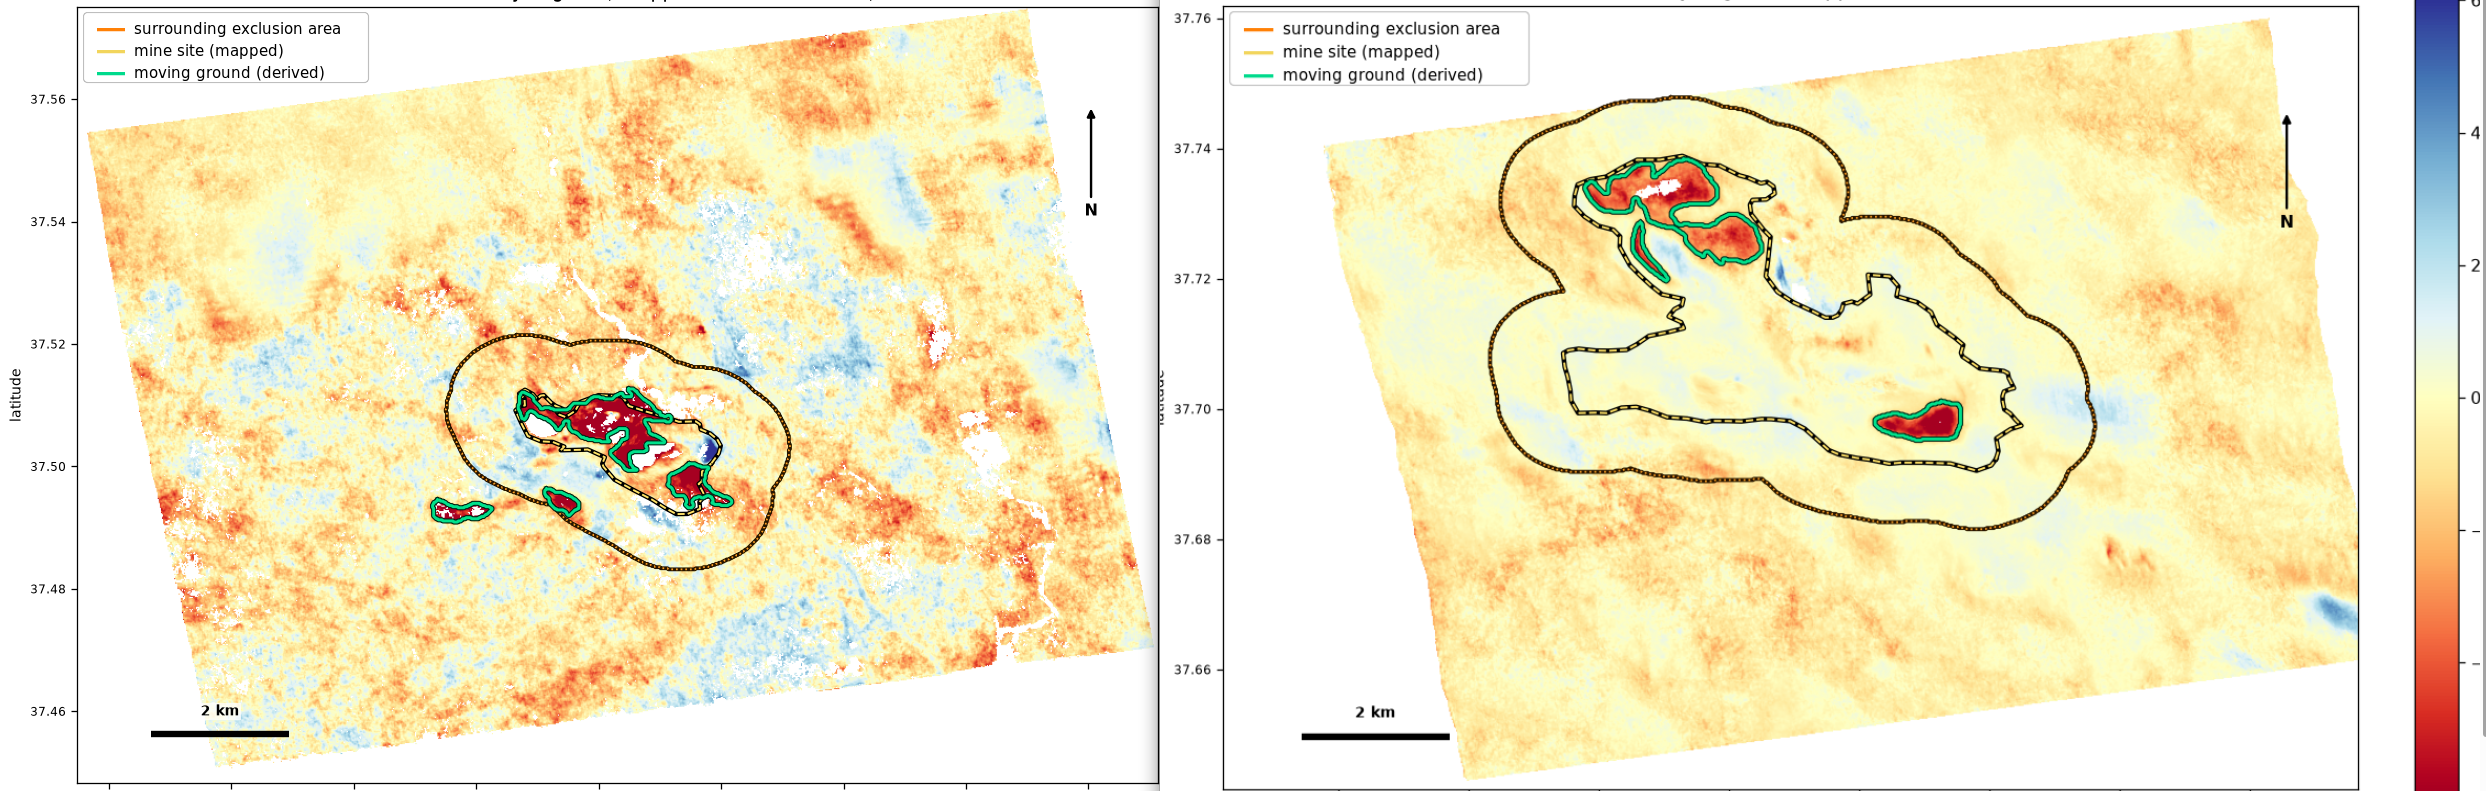
- Cover image: A composite of the Riotinto and Las Cruces Sentinel-1 ground-motion results presented in this post.
Monopteryx supplies fixed-scope measurements from archive satellite radar, with optical context, verification results and limitations ready to integrate into a wider technical assessment.